

SQS Monitor Configuration Guide on the Elven Platform
The SQS Monitor from Elven Platform enables checks based on key queries in the SQS queue. This feature helps configure continuous checks, set alerts, and create thresholds for automatic incident creation, ensuring you are quickly informed about any irregularities in connectivity or service performance.
Amazon SQS (Simple Queue Service) is a managed message queue service by AWS, designed to facilitate communication between distributed systems. It allows for the sending, receiving, and storing of messages between components in an asynchronous and scalable manner, ensuring reliable delivery and separation of concerns in modern applications. Ideal for scenarios such as system integration, microservices architectures, and background task processing, SQS eliminates the complexity of queue management.
Accessing SQS Monitoring
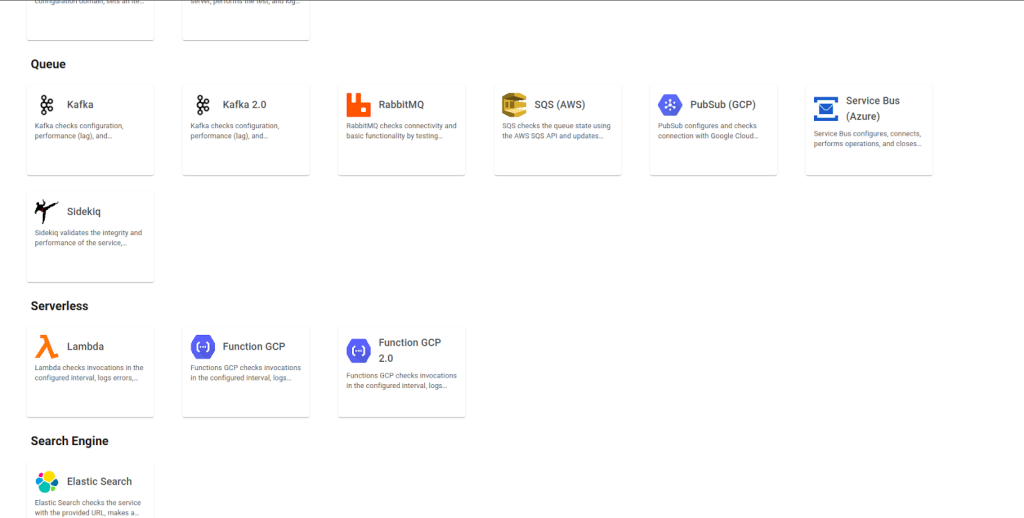
Navigate to the main menu and click on Services Hub.
In Queue, select the item SQS (AWS).
Monitoring Configuration
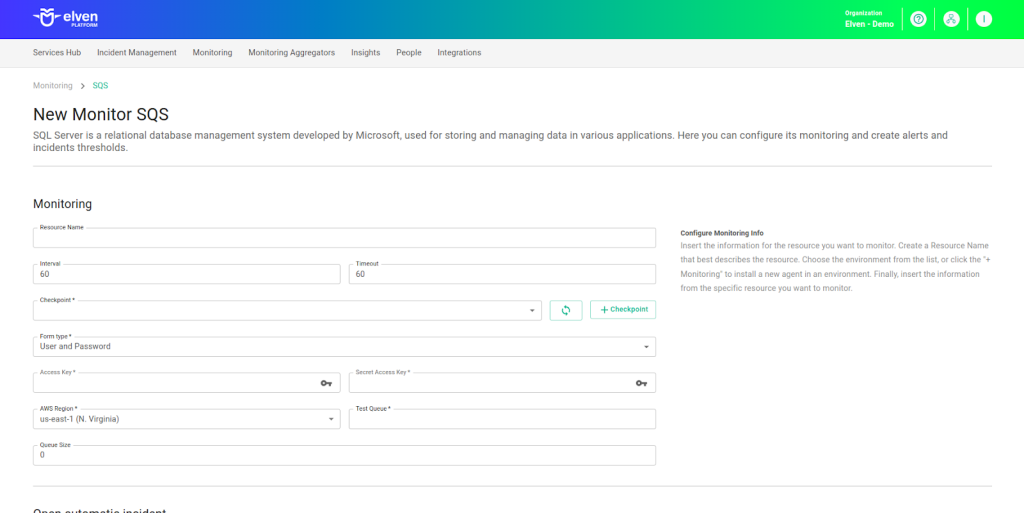
Monitoring your services has never been easier! To configure AWS SQS monitoring in the Elven Platform, start by assigning a clear name to the resource in the Resource Name field. Choose something that makes it easy to identify, especially in environments with multiple services being monitored.
Next, adjust the Interval between checks and the Timeout for responses, ensuring that monitoring is aligned with the importance and criticality of the service.
In the Checkpoint Cloud field, select the environment where the monitoring agent will run. If you don’t have an environment configured, you can create a new one by clicking + Checkpoint.
Then, in Form Type, choose the authentication format that best fits your scenario. If you select User and Password, enter your AWS credentials in the Access Key and Secret Access Key fields, and configure the AWS Region corresponding to the region where the SQS queue is located. This information is essential to authenticate and establish the connection with the service.
Now, fill in the Test Queue and Queue Size fields. In Test Queue, specify a test queue that will be used to validate whether the monitoring configuration is working correctly. The Queue Size field automatically displays the number of messages in the queue, helping you identify bottlenecks or overloads and optimize message processing.
If you choose to monitor a resource using only a URL, select Form Type as Healthcheck URL and enter the resource’s address in the corresponding field. It’s important to remember that the Host and Healthcheck URL fields only accept URLs. If you need to use an IP address, it must be stored in a secret to maintain the security and organization of the information.
Automatic Incident Opening
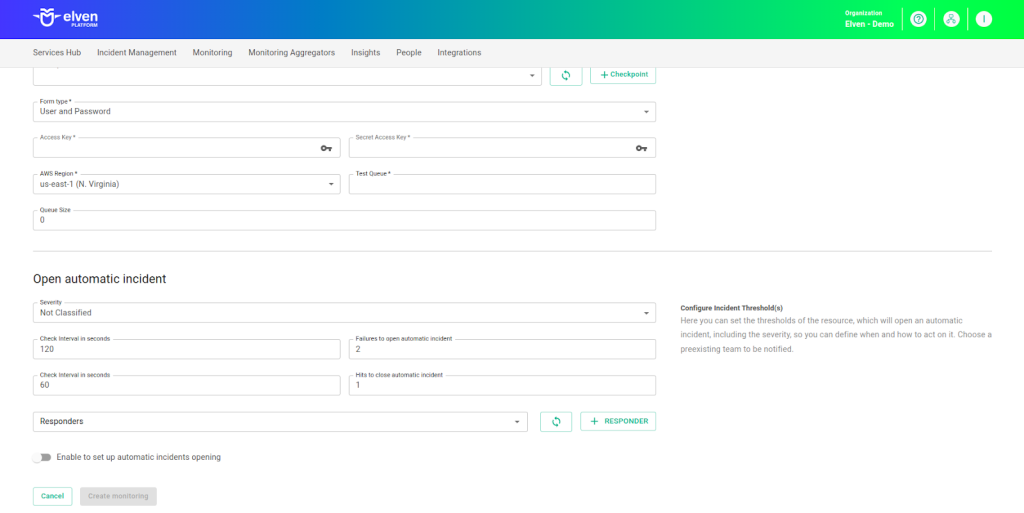
You can configure automatic incident opening to ensure a quick response to critical issues. To begin, define the incident severity, allowing you to prioritize according to urgency. Next, adjust the Check Interval, specifying the check frequency in seconds to continuously monitor the resource. This helps ensure you're always one step ahead, detecting problems as soon as they arise.
Additionally, select the team to be notified whenever an incident occurs and enable the "Enable to set up automatic incidents opening" option to ensure the configuration is active. With this setup, the platform automates incident management, making the response process faster and more efficient, without the need for manual intervention. This ensures your team is always ready to resolve any issue with speed and precision.
Maintenance Window
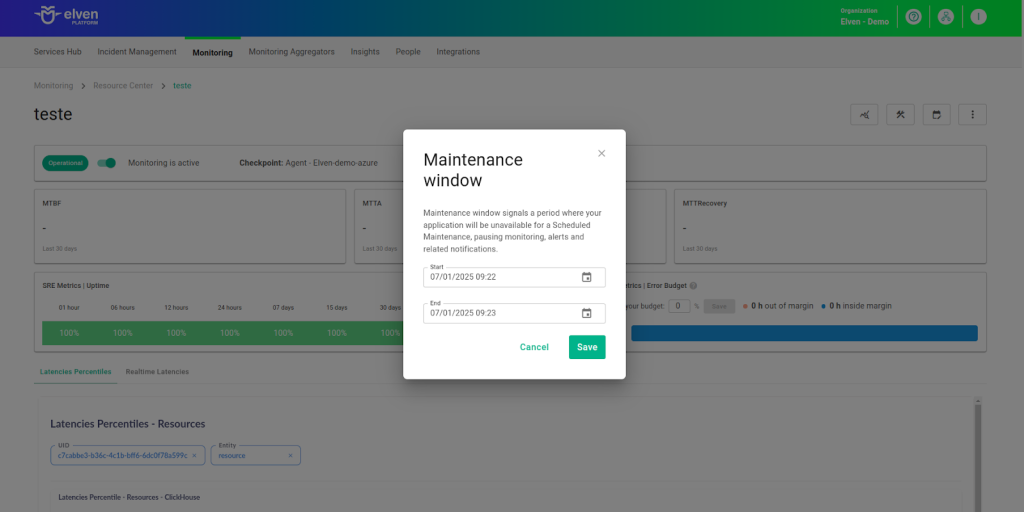
Maintenance Window is an essential feature for managing planned maintenance periods in your application. During this interval, checks are temporarily paused, preventing monitoring, alerts, and notifications from being triggered while you perform adjustments or updates. This allows maintenance to proceed smoothly, without generating unnecessary notifications or false alarms, ensuring your operations continue in an orderly fashion without unexpected interruptions in performance reports.
For example, imagine you need to update the payment system of an e-commerce platform, making backend adjustments such as installing new security certificates. To do this, you can configure the Maintenance Window for a specific time, such as 12/13/2024, from 2:00 PM to 2:30 PM. During this period, the Elven Platform suspends checks, preventing the monitoring system from registering temporary failures or triggering false alerts. This way, you can make the necessary changes calmly, knowing that the monitoring system will not be impacted during maintenance.
This approach ensures that updates are carried out in an organized manner, without affecting the user experience or generating unwanted notifications.
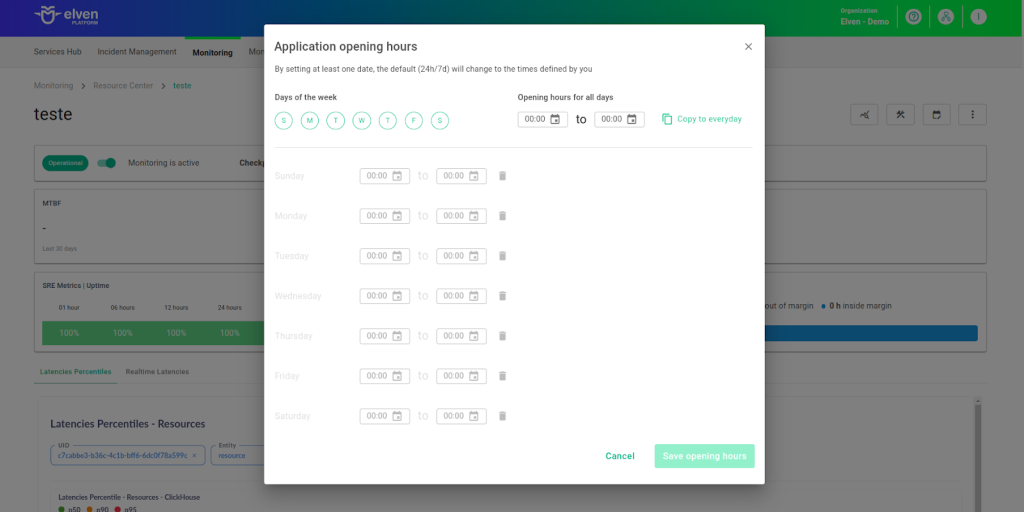
Application Opening Hours
You can also rely on the Application Opening Hours feature, which allows you to configure your application's operating hours. This functionality is essential for customizing monitoring based on the periods when your application is actually active, avoiding alerts and notifications outside of business hours. This makes monitoring more aligned with your business’s real needs, ensuring more accurate reports and efficient management.
For example, imagine your application operates only from Monday to Friday, between 9:00 AM and 6:00 PM. You can configure the Application Opening Hours to reflect this schedule by specifying the days and operating periods. With this setup, the Elven Platform automatically disables checks outside of these hours, preventing the logging of failures that don’t affect end users and avoiding unnecessary alerts. This approach optimizes performance analysis, focusing only on relevant periods and providing a clearer view of your application's health during its operating hours.
Glossary of Technical Terms
SQS: Managed message queue service from AWS, designed for asynchronous and reliable communication between distributed systems. It enables decoupling of software components and high-scale message processing. Offers high availability, automatic scalability, and supports both standard and FIFO queue models. Ideal for system integration, microservices, and background task processing, with the simplicity of a fully managed solution.
Interval: Time interval between automatic checks performed during monitoring.
Timeout: Maximum time allowed for monitoring to receive a response from the monitored resource before registering a failure.
Checkpoint Cloud: Location where the monitoring agent is hosted, which can be a preexisting environment or one created by the user.
Secret: Resource used to store sensitive information, such as IP addresses or credentials, ensuring security and organization.
Access Key: Field to enter the AWS access key. This key is part of the credentials required to authenticate and access the SQS queue.
Secret Access Key: Field to enter the secret key associated with the AWS access key. Together with the Access Key, these credentials authenticate your account and provide access to the SQS queue.
AWS Region: A dropdown list where you select the AWS region in which the SQS queue is located.
Test Queue: Field used to specify a test queue in Amazon SQS, aimed at validating whether the monitoring configuration is functioning correctly.
Queue Size: The number of messages present in the Amazon SQS queue. This metric helps identify bottlenecks or overloads, allowing adjustments to optimize message processing and ensure system performance.
Healthcheck URL: URL used to check the health of the RabbitMQ server, an alternative method for authentication and monitoring.
Enable to set up automatic incidents opening: Option that, when enabled, activates automatic incident creation upon detection of critical issues.
Severity: Level of criticality assigned to an incident, allowing it to be prioritized according to urgency.
Check Interval: Time interval, in seconds, for performing continuous checks on the monitored resource.
Maintenance Window: Feature that temporarily pauses monitoring, alerts, and notifications during planned maintenance periods.
Application Opening Hours: Configuration that defines the operating hours of the application, aligning monitoring with active periods and avoiding alerts outside those hours.
Last updated
Was this helpful?