

Elasticsearch Monitor Configuration Guide on the Elven Platform
The Elastic Search Monitor from the Elven Platform enables checks based on key queries in Elasticsearch indexes. This feature helps configure continuous checks, define alerts, and set thresholds for automatic incident opening, ensuring you are promptly informed about any irregularities in connectivity or service performance.
Elasticsearch is a highly scalable and efficient data search and analytics solution, designed to process large volumes of information in real time. It allows you to index, search, and visualize data quickly and accurately, and is widely used in use cases such as log monitoring, application data analysis, website search, and much more.
Accessing the Elastic Search Monitoring
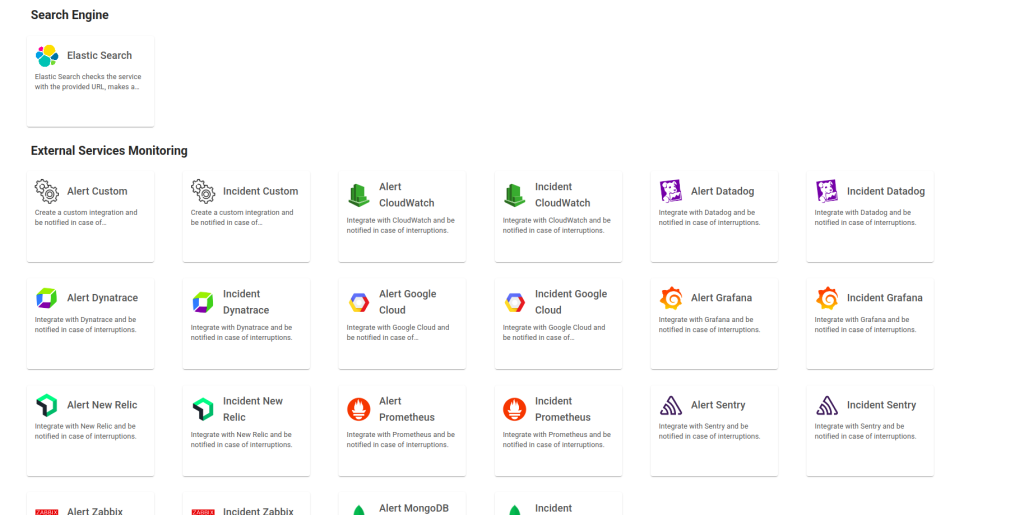
Navigate to the main menu and click on Services Hub.
Under Search Engine, select the Elastic Search item.
Monitoring Configuration
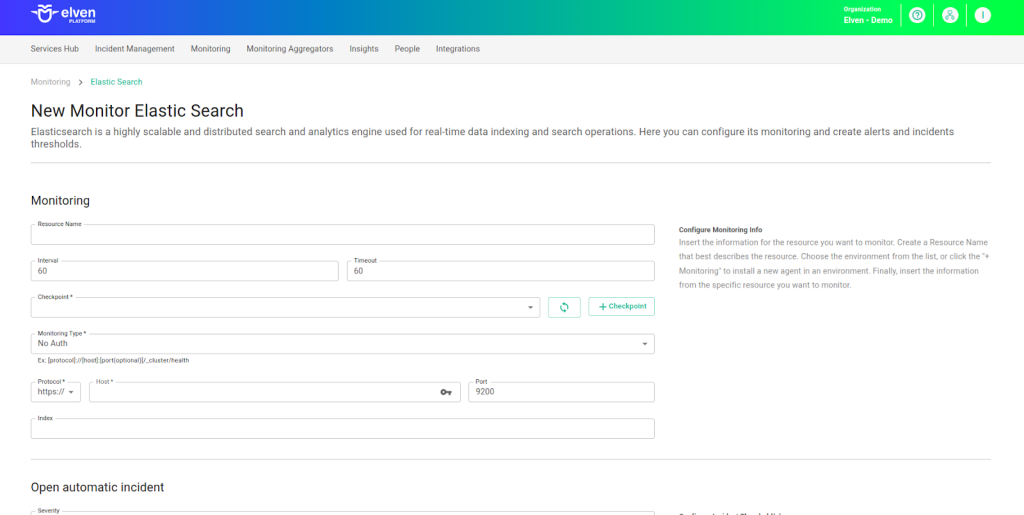
Monitoring the availability of your services has never been easier. Start by giving a clear name to the resource you want to track (Resource Name) to make identification easier. Then, adjust the interval between checks (Interval) and the response timeout (Timeout).
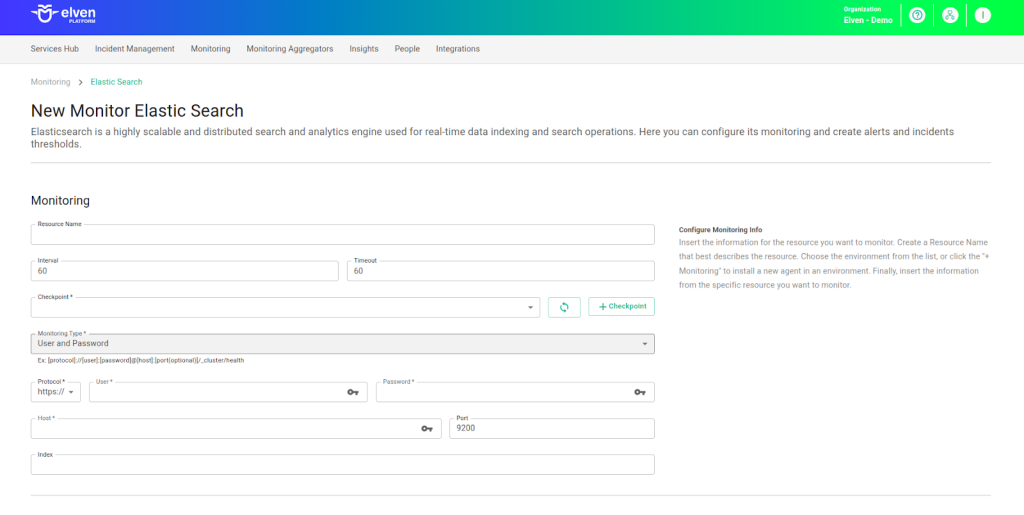
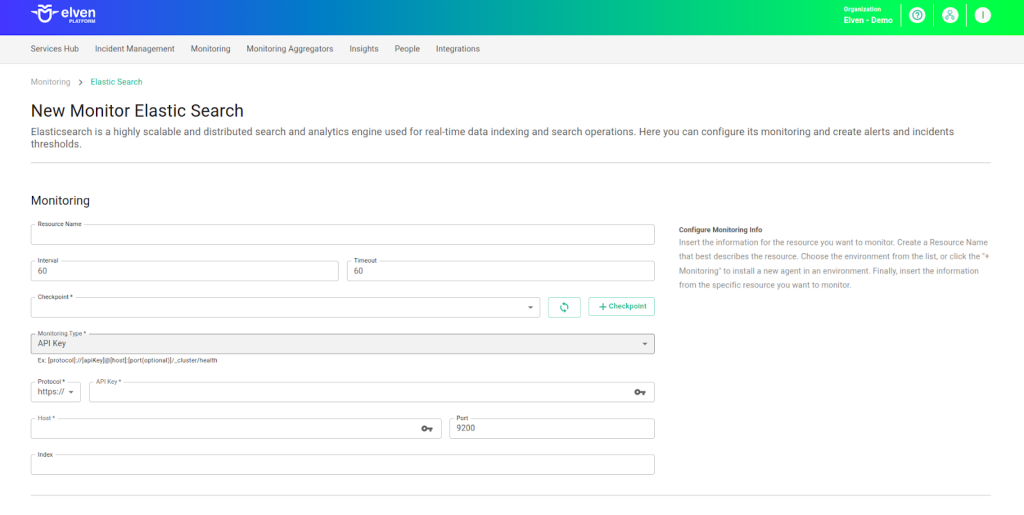
Select where the monitoring agent is located (Checkpoint Cloud) by choosing the appropriate Environment. If it doesn’t exist, you can create one using + Checkpoint. Next, choose the authentication type in the Monitoring Type field. Here, you define how the Elven Platform will connect to Elasticsearch. If your environment does not require authentication, select No Auth. But if it is protected by username and password, or if you use an API Key for authentication, choose the corresponding option. These settings ensure that communication is secure and tailored to your environment.
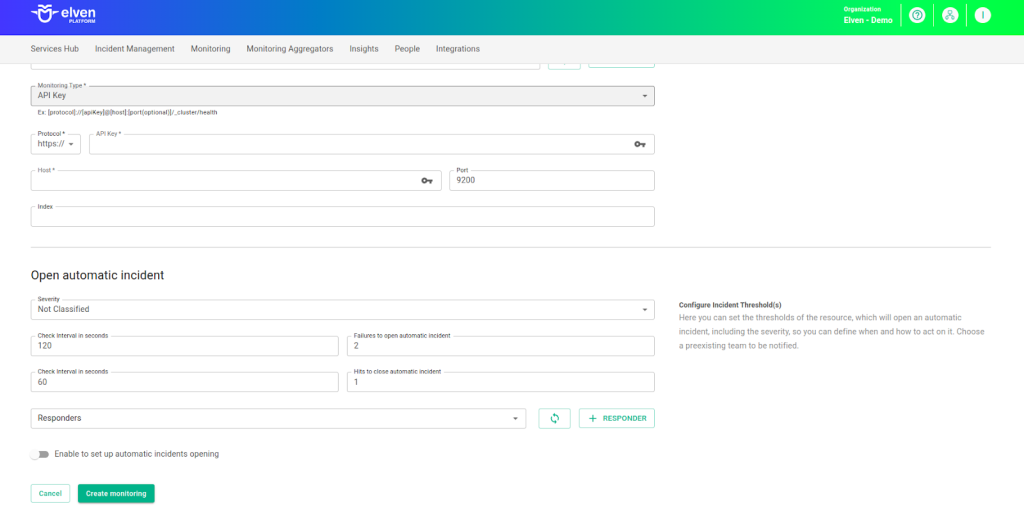
After that, it’s time to configure the Protocol, Host, and Port. If your Elasticsearch is set up for HTTPS, select that option to ensure that the exchanged information is encrypted. In the Host field, enter the server address. In the Port field, enter the number used by your service — the default value is 9200, but it may vary depending on your environment’s configuration. These details are essential for the Elven Platform to locate your Elasticsearch and establish the correct connection.
Keep in mind that the Host field only accepts URLs; if you need to use an IP address, it must be stored in a Secret to ensure the security and organization of the information.
Finally, in the Index field, enter the name of the index you want to monitor. This allows the Elven Platform to focus exactly on the data that matters to you. Once everything is filled out, save your configuration and let the Elven Platform take care of the rest.
Without Authentication
Authentication with Username and Password
Authentication via API Key
Automatic Incident Opening
You can configure automatic incident opening to ensure a quick response to critical issues. To begin, define the incident severity, allowing you to prioritize according to urgency. Next, adjust the Check Interval, specifying the check frequency in seconds to continuously monitor the resource. This helps ensure you're always one step ahead, detecting problems as soon as they arise.
Additionally, select the team to be notified whenever an incident occurs and enable the "Enable to set up automatic incidents opening" option to ensure the configuration is active. With this setup, the platform automates incident management, making the response process faster and more efficient, without the need for manual intervention. This ensures your team is always ready to resolve any issue with speed and precision.
Maintenance Window
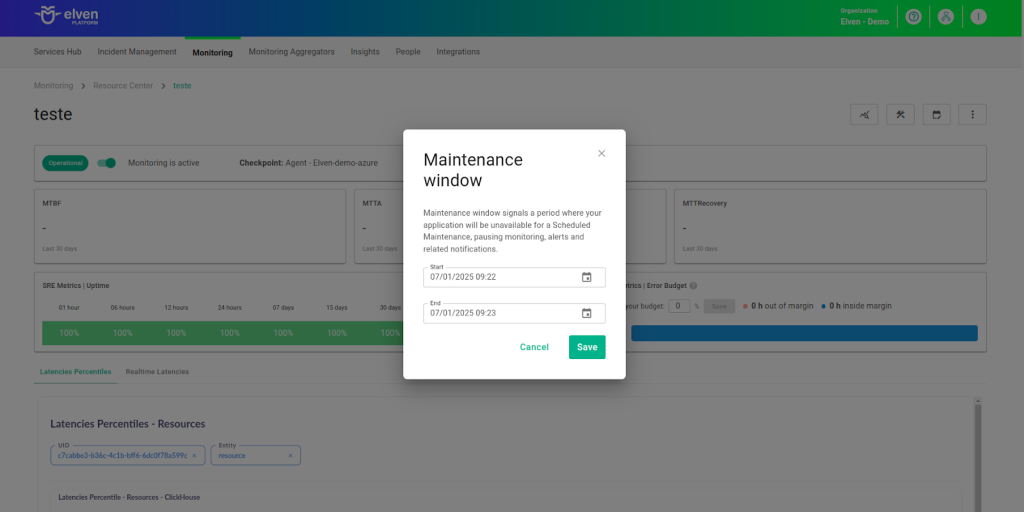
We also have the Maintenance Window, an essential feature for managing planned maintenance periods in your application. During this time, checks are temporarily paused, preventing monitoring, alerts, and notifications from being triggered while you perform updates or adjustments. This allows maintenance to proceed smoothly, without generating unnecessary notifications or false alarms, ensuring your operations continue in an orderly manner without unexpected interruptions in performance reports.
For example, imagine you need to update the payment system of an e-commerce platform, making backend adjustments such as installing new security certificates. To do this, you can configure the Maintenance Window for a specific time, such as 12/13/2024, from 2:00 PM to 2:30 PM. During this period, the Elven Platform suspends checks, preventing the monitoring system from logging temporary failures or triggering false alerts. This way, you can make the necessary changes calmly, knowing that the monitoring system will not be affected during maintenance. This approach ensures the update is carried out in an organized manner, without impacting the user experience or generating unwanted notifications.
Application Opening Hours
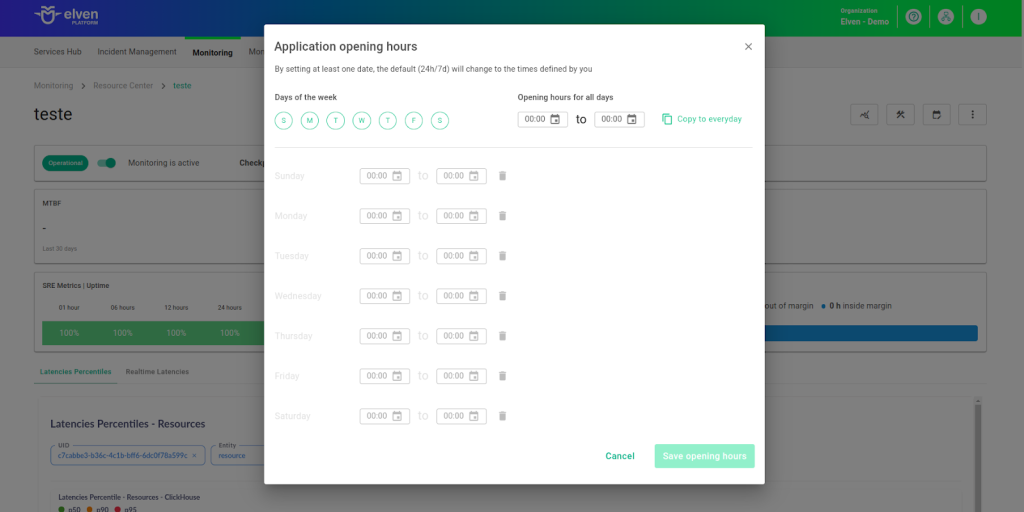
You can also rely on the Application Opening Hours feature, which allows you to configure your application's operating hours. This functionality is essential for customizing monitoring based on the periods when your application is actually active, avoiding alerts and notifications outside of business hours. This way, monitoring becomes more aligned with your business’s real needs, ensuring more accurate reports and efficient management.
For example, imagine your application operates only from Monday to Friday, between 9:00 AM and 6:00 PM. You can configure Application Opening Hours to reflect this schedule by specifying the working days and hours. With this setup, the Elven Platform automatically disables checks outside of these hours, preventing the logging of failures that don’t affect end users and avoiding unnecessary alerts. This approach optimizes performance analysis, focusing only on relevant periods and providing a clearer view of your application’s health during its operating hours.
Glossary of Technical Terms
Elasticsearch: Elasticsearch is an open-source search and analytics engine, widely used to store, search, and analyze large volumes of data in real time. It is ideal for use cases such as log monitoring, security analytics, custom search engines, and data visualization. Elasticsearch enables fast and scalable queries over large amounts of structured and unstructured data, using optimized indexes and a powerful query language (DSL). With native integration with tools like Kibana and Logstash, it is a core part of the Elastic Stack, providing a robust solution for real-time data analysis.
Timeout: Maximum time allowed for the monitoring system to receive a response from the monitored resource before registering a failure.
Checkpoint Cloud: Location where the monitoring agent is hosted, which can be a preexisting environment or one created by the user.
Monitoring Type: Field that defines the authentication method the Elven Platform will use to connect to Elasticsearch. Available options include:
No Auth: No authentication, for open environments.
User and Password: Authentication using username and password.
API Key: Authentication via API key, providing enhanced security in protected environments.
Protocol: Defines the communication protocol between the Elven Platform and Elasticsearch. Options include HTTP or HTTPS, with HTTPS recommended to ensure data encryption.
Host: Field where the Elasticsearch server address must be entered. It only accepts URLs, ensuring organization and security. If you need to use an IP address, it is recommended to configure it as a Secret for added protection.
Port: Defines the port number used to access the Elasticsearch service. The default value is 9200, but it may vary depending on your environment’s configuration.
Index: Field to specify the name of the Elasticsearch index to be monitored. An index is a collection of documents in Elasticsearch, and this setting allows the Elven Platform to focus only on the relevant data.
Secret: A resource used to store sensitive information, such as IP addresses or credentials, securely and in an organized manner within the platform.
Enable to set up automatic incidents opening: Option that, when enabled, activates automatic incident opening upon detection of critical issues.
Severity: Level of criticality assigned to an incident, allowing it to be prioritized based on urgency.
Check Interval: Time interval, in seconds, for performing continuous checks on the monitored resource.
Maintenance Window: Feature that temporarily pauses monitoring, alerts, and notifications during planned maintenance periods.
Application Opening Hours: Configuration that defines the operating hours of the application, aligning monitoring with active periods and avoiding alerts outside those hours.
Last updated
Was this helpful?