

AWS Lambda Monitor Configuration Guide on the Elven Platform
The AWS Lambda Monitor from Elven Platform enables checks based on key queries within Lambda functions. This feature helps configure continuous checks, set up alerts, and define thresholds for automatic incident opening, ensuring you are quickly informed about any irregularities in connectivity or service performance.
AWS Lambda is a serverless computing service from Amazon Web Services (AWS) that allows you to run code in response to events without the need to provision or manage servers. With Lambda, you can execute functions in a scalable and on-demand manner, paying only for the code execution time, with no fixed infrastructure costs.
The service is ideal for real-time data processing tasks, such as image or file processing, sending notifications, or even system and microservices integration. With support for multiple programming languages and easy integration with other AWS services, AWS Lambda offers an efficient and cost-effective way to build highly scalable and resilient applications. Its serverless nature eliminates the complexity of server management, allowing developers to focus solely on business logic and innovation.
Accessing AWS Lambda Monitoring
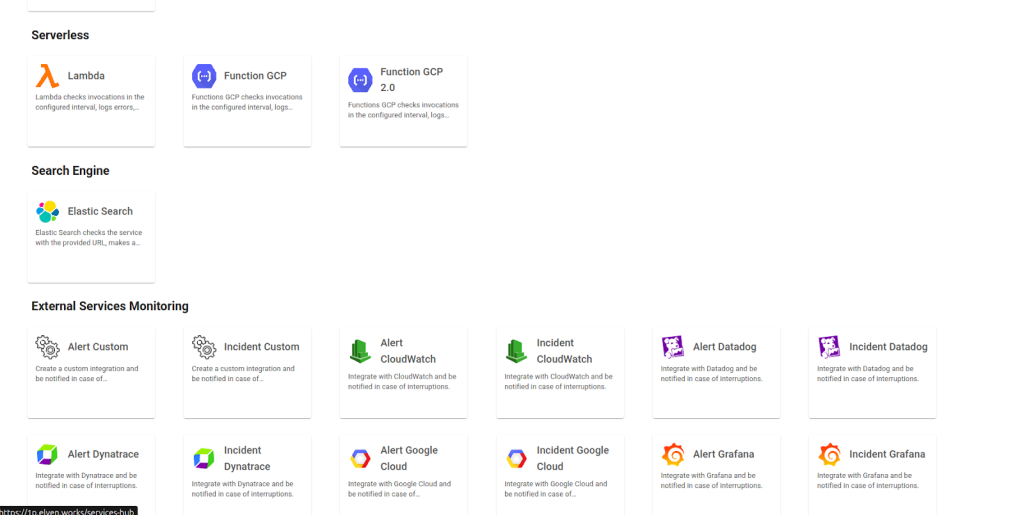
Navigate to the main menu and click on Services Hub.
Under Serverless, select the item Lambda.
Monitoring Configuration
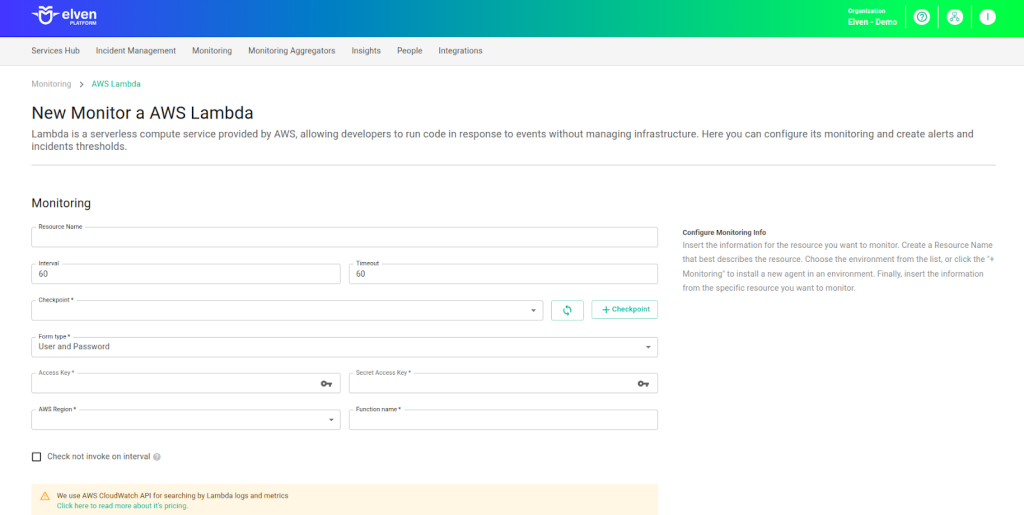
Monitoring the availability of your services has never been easier. Start by giving a clear name to the resource you want to track (Resource Name) to make identification easier. Then, adjust the interval between checks (Interval) and the response timeout (Timeout).
Select where the monitoring agent is located (Checkpoint Cloud) by choosing the appropriate Environment. If it doesn’t exist, you can create one using + Checkpoint.
To configure AWS Lambda monitoring in Elven Platform, you need to define the Form Type. You can choose between User and Password or Healthcheck URL.
In User and Password, you must enter your AWS access credentials, which consist of the Access Key and Secret Access Key. These keys are required for the platform to interact with Lambda resources. You can generate them directly in the AWS Console, where you can create a new IAM user with the appropriate permissions to access and monitor the Lambda function.
Additionally, you’ll need to configure the AWS Region, which specifies the region where your Lambda function is hosted. This helps Elven Platform connect properly to the AWS service.
Next, enter the Function Name, which corresponds to the name of the Lambda function you want to monitor. This name is essential to identify the specific function within your AWS environment.
In Healthcheck URL, you can simply enter the URL of the resource to be monitored. Note that the Healthcheck URL field only accepts URLs; if you need to use an IP address, it must be created as a secret to ensure the security and organization of the information.
Finally, the Check not invoke on interval option is an important setting: when enabled, it will trigger a monitoring failure if the function is not invoked within the configured time interval. This helps ensure that the Lambda function is being triggered regularly, preventing inactivity and potential workflow failures.
Automatic Incident Opening
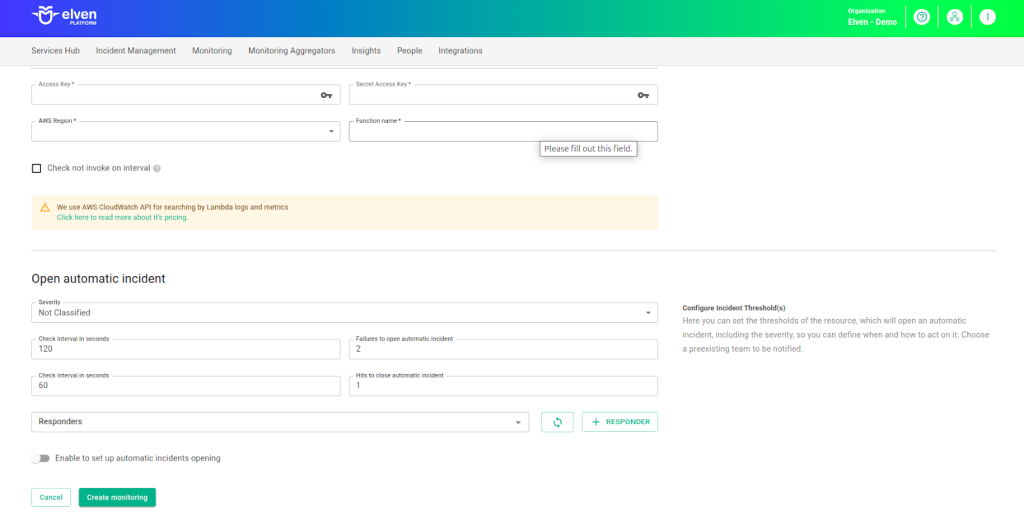
You can configure automatic incident opening to ensure a quick response to critical issues. To begin, define the incident severity, allowing you to prioritize according to urgency. Next, adjust the Check Interval, specifying the check frequency in seconds to continuously monitor the resource. This helps ensure you're always one step ahead, detecting problems as soon as they arise.
Additionally, select the team to be notified whenever an incident occurs and enable the "Enable to set up automatic incidents opening" option to ensure the configuration is active. With this setup, the platform automates incident management, making the response process faster and more efficient, without the need for manual intervention. This ensures your team is always ready to resolve any issue with speed and precision.
Maintenance Window
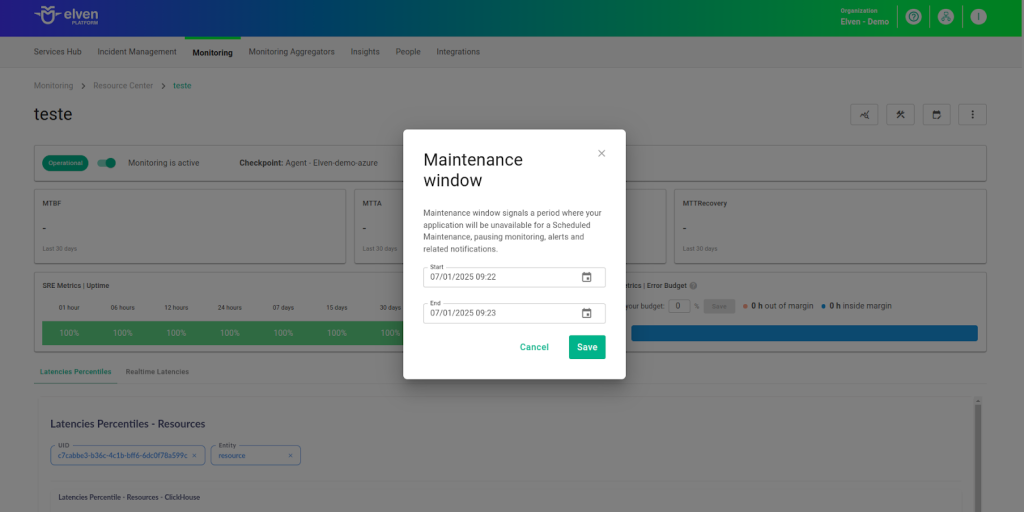
We also have the Maintenance Window, an essential feature for managing planned maintenance periods in your application. During this time, checks are temporarily paused, preventing monitoring, alerts, and notifications from being triggered while you perform updates or adjustments. This allows maintenance to proceed smoothly, without generating unnecessary notifications or false alarms, ensuring your operations continue in an orderly manner without unexpected interruptions in performance reports.
For example, imagine you need to update the payment system of an e-commerce platform, making backend changes such as installing new security certificates. To do this, you can configure the Maintenance Window for a specific time, such as 12/13/2024, from 2:00 PM to 2:30 PM. During this period, the Elven Platform suspends checks, preventing the monitoring system from logging temporary failures or triggering false alerts. This way, you can make the necessary changes calmly, knowing that the monitoring system won’t be affected during maintenance. This approach ensures the update is carried out in an organized manner, without impacting the user experience or generating unwanted notifications.
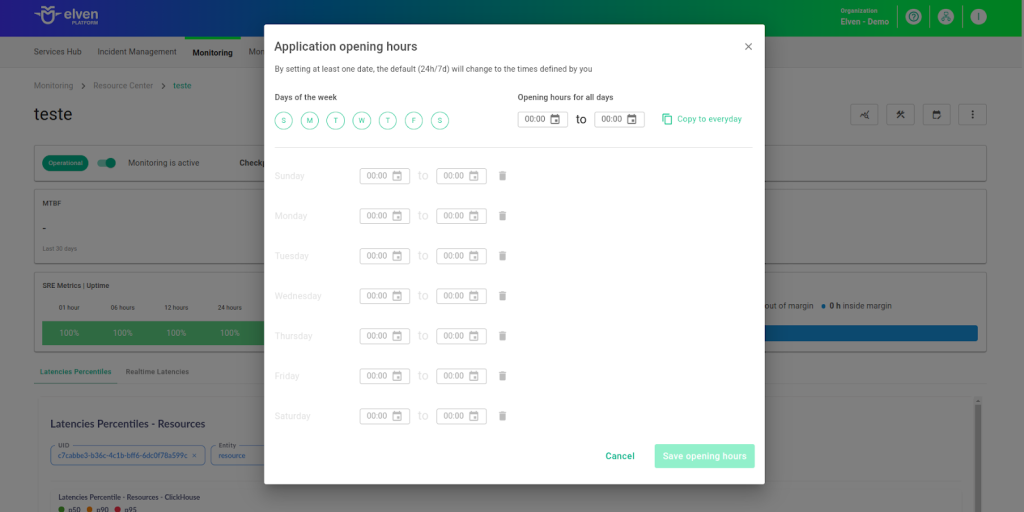
Application Opening Hours
You can also rely on the Application Opening Hours feature, which allows you to configure your application's operating hours. This functionality is essential for customizing monitoring based on the periods when your application is actually active, avoiding alerts and notifications outside of business hours. This ensures that monitoring is better aligned with your business’s real needs, providing more accurate reports and efficient management.
For example, imagine your application operates only from Monday to Friday, between 9:00 AM and 6:00 PM. You can configure Application Opening Hours to reflect this schedule by specifying the days and operating periods. With this setup, the Elven Platform automatically disables checks outside these hours, preventing the logging of failures that don’t affect end users and avoiding unnecessary alerts. This approach optimizes performance analysis, focusing only on relevant periods and providing a clearer view of your application's health during its operating hours.
Glossary of Technical Terms
AWS Lambda: AWS Lambda is a serverless computing service that allows you to run code in response to events, without the need to manage servers. It enables the execution of functions in a scalable, efficient, and cost-effective way, making it ideal for real-time tasks such as file uploads, database interactions, or API invocations. Lambda is automatically triggered by events from other AWS services, such as S3, DynamoDB, or API Gateway, and you only pay for the code execution time. Its serverless nature eliminates the need for server provisioning and maintenance, allowing developers to focus solely on code and business logic. With support for multiple languages like Node.js, Python, Java, Ruby, and others, AWS Lambda is a flexible and efficient solution for asynchronous and scalable tasks.
Timeout: The maximum time allowed for the monitoring system to receive a response from the monitored resource before registering a failure.
Checkpoint Cloud: The location where the monitoring agent is deployed, which can be a preexisting environment or one created by the user.
Access Key: The Access Key is a key generated in AWS that, together with the Secret Access Key, authenticates the connection between Elven Platform and AWS. These keys are created in the AWS Console when setting up an IAM user with the appropriate permissions.
Secret Access Key: The Secret Access Key is the secret key paired with the Access Key. Together, they are used to authenticate and authorize communication between Elven Platform and AWS resources.
AWS Region: The AWS region where the Lambda function is hosted. This field allows Elven Platform to connect properly to the Lambda service located in the specified region.
Function Name: The name of the AWS Lambda function you want to monitor. This name is essential to uniquely identify the function within your AWS environment.
Healthcheck URL: The URL of the resource you want to monitor. This field is used to check the health of the Lambda function. If you need to use an IP address, it is recommended to store it securely in a secret.
Check not invoke on interval: An option that, when enabled, triggers a monitoring failure if the Lambda function is not invoked within the configured time interval. This helps ensure the function is being triggered regularly, avoiding failures and inactivity.
Enable to set up automatic incidents opening: An option that, when activated, enables automatic incident creation upon detection of critical issues.
Severity: The level of criticality assigned to an incident, allowing it to be prioritized based on urgency.
Check Interval: The time interval, in seconds, for performing continuous checks on the monitored resource.
Maintenance Window: A feature that temporarily pauses monitoring, alerts, and notifications during planned maintenance periods.
Application Opening Hours: A configuration that defines your application's operating hours, aligning monitoring with active periods and avoiding alerts outside those times.
Last updated
Was this helpful?