

MySQL Database Monitor Configuration Guide on the Elven Platform
The MySQL Monitor from the Elven Platform enables checks based on key queries in MySQL. This feature helps configure continuous checks, define alerts, and set thresholds for automatic incident creation, ensuring you are promptly informed about any irregularities in connectivity or service performance.
MySQL is an open-source relational database management system widely recognized for its speed, simplicity, and reliability. It offers full SQL support and includes features that ensure efficient performance, integration with various applications, and ease of use. MySQL is extensively used in a variety of scenarios, from websites and web applications to large enterprise platforms, and is valued for its scalability, stability, and an active community that continuously enhances the system.
Accessing MySQL Monitoring
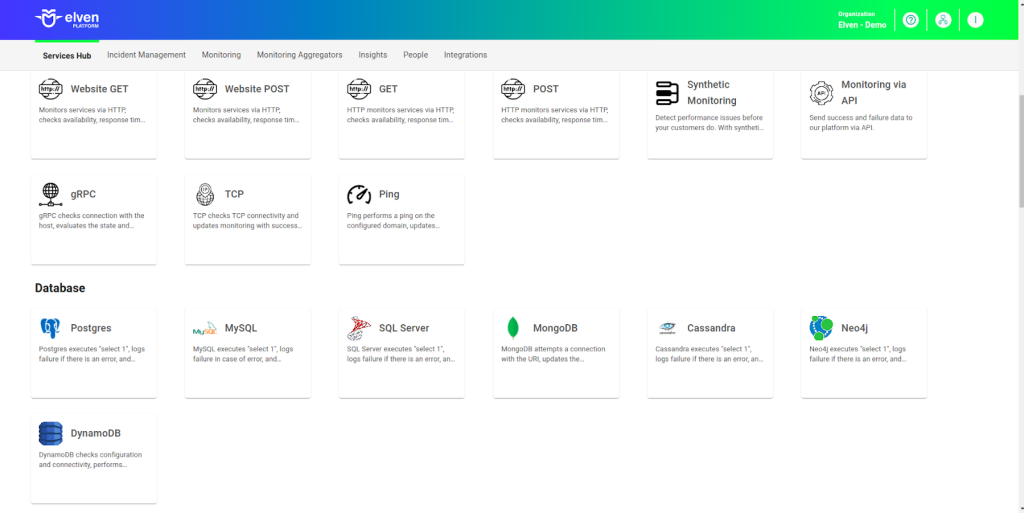
Navigate to the main menu and click on Services Hub.
Under Database, select the MySQL item.
Monitoring Configuration
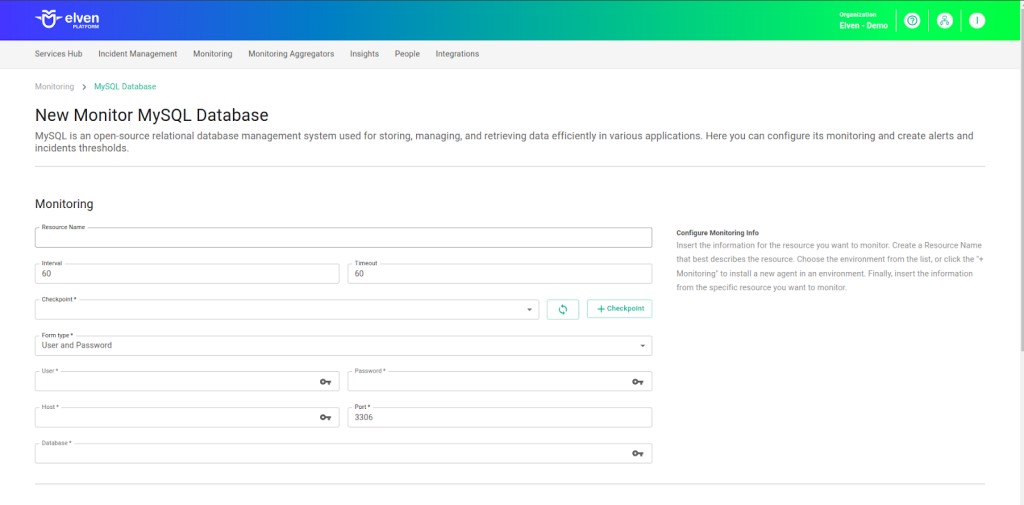
Monitoring the availability of your services has never been easier. Start by giving a clear name to the resource you want to track (Resource Name) to make identification easier. Then, adjust the interval between checks (Interval) and the response timeout (Timeout).
Select where the monitoring agent is located (Checkpoint Cloud) by choosing the Environment. If it doesn’t exist, you can create one using + Checkpoint. After this configuration, in Form Type, you can choose between User and Password or Healthcheck URL. In User and Password, you must provide the Username and Password, which are the database access credentials. Next, enter the server address in the Host field and the Port, which by default is 3306, but can be adjusted if the database is configured on a different port.
In the Database field, specify the name of the database to be monitored. In Healthcheck URL, you can simply enter the URL of the resource to be monitored.
Keep in mind that the Host and Healthcheck URL fields only accept URLs; if you need to use an IP address, you must create it as a secret to ensure the security and organization of the information.
Automatic Incident Opening
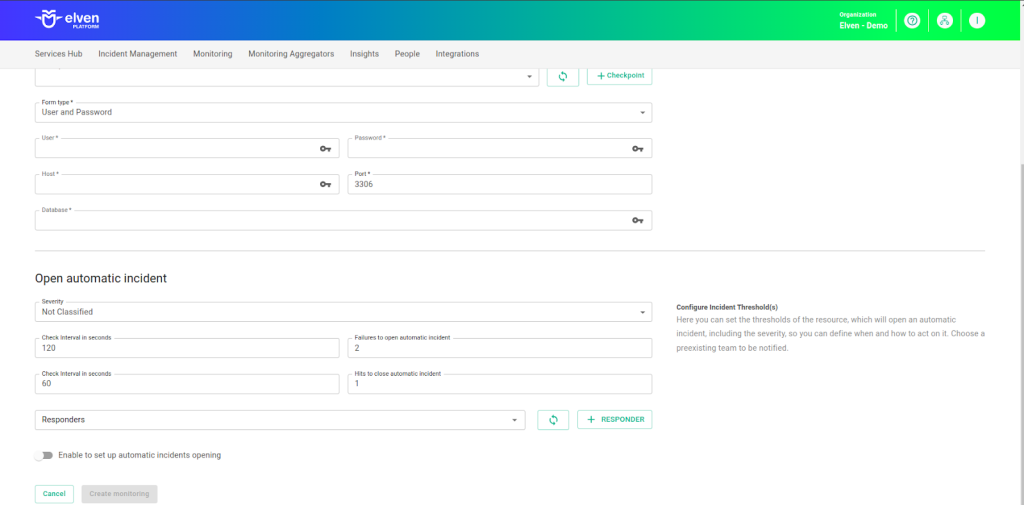
You can configure automatic incident opening to ensure a quick response to critical issues. To begin, define the incident severity, allowing you to prioritize according to urgency. Next, adjust the Check Interval, specifying the check frequency in seconds to continuously monitor the resource. This helps ensure you're always one step ahead, detecting problems as soon as they arise.
Additionally, select the team to be notified whenever an incident occurs and enable the "Enable to set up automatic incidents opening" option to ensure the configuration is active. With this setup, the platform automates incident management, making the response process faster and more efficient, without the need for manual intervention. This ensures your team is always ready to resolve any issue with speed and precision.
Maintenance Window
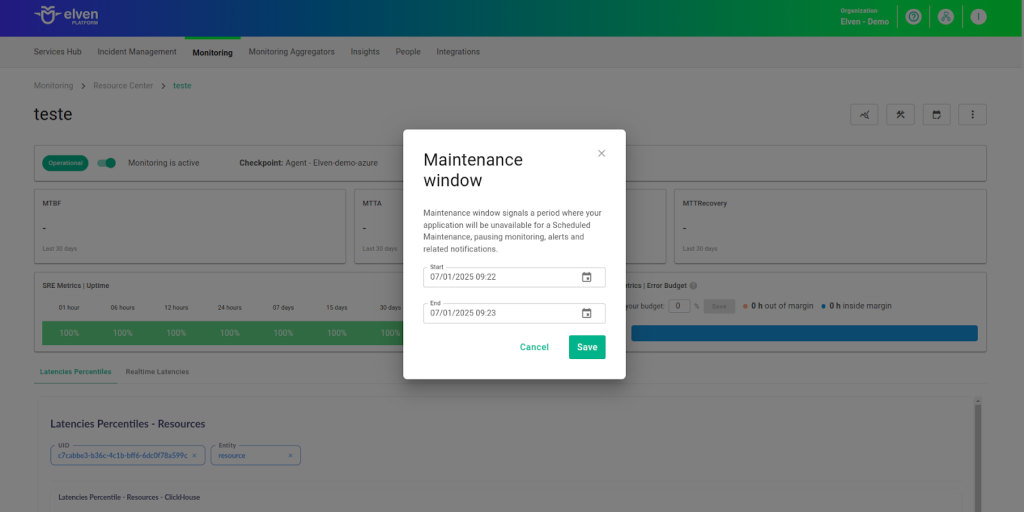
The Maintenance Window is an essential feature for managing planned maintenance periods in your application. During this time, checks are temporarily paused, preventing monitoring, alerts, and notifications from being triggered while you perform adjustments or updates. This allows maintenance to proceed smoothly, without generating unnecessary notifications or false alarms, ensuring your operations continue in an orderly manner without unexpected interruptions in performance reports.
For example, imagine you need to update the payment system of an e-commerce platform, making backend adjustments such as installing new security certificates. To do this, you can configure the Maintenance Window for a specific time, such as 12/13/2024, from 2:00 PM to 2:30 PM. During this period, the Elven Platform suspends checks, preventing the monitoring system from logging temporary failures or triggering false alerts. This way, you can make the necessary changes calmly, knowing that the monitoring system will not be affected during maintenance. This approach ensures the update is carried out in an organized manner, without impacting the user experience or generating unwanted notifications.
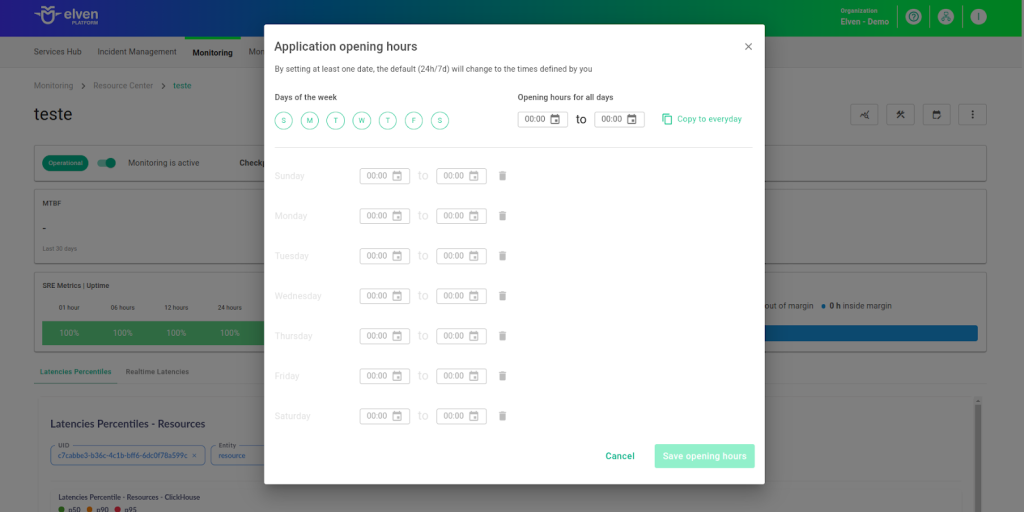
Application Opening Hours
You can also rely on the Application Opening Hours feature, which allows you to configure your application's operating hours. This functionality is essential for customizing monitoring based on the periods when your application is actually active, avoiding alerts and notifications outside of business hours. This makes monitoring more aligned with your business’s real needs, ensuring more accurate reports and efficient management.
For example, imagine your application operates only from Monday to Friday, between 9:00 AM and 6:00 PM. You can configure Application Opening Hours to reflect this schedule by specifying the working days and hours. With this setup, the Elven Platform automatically disables checks outside of these hours, preventing the logging of failures that don’t affect end users and avoiding unnecessary alerts. This approach optimizes performance analysis, focusing only on relevant periods and providing a clearer view of your application’s health during its operating hours.
Glossary of Technical Terms
MySQL: Open-source relational database management system, known for its speed, simplicity, and reliability. Widely used in web applications, enterprise systems, and e-commerce platforms.
Interval: Time interval between the automatic checks performed during monitoring.
Timeout: Maximum time allowed for the monitoring system to receive a response from the monitored resource before registering a failure.
Checkpoint Cloud: Location where the monitoring agent is hosted, which can be a preexisting environment or one created by the user.
Host: Address (URL) of the monitored resource. If an IP address is required, it must be stored in a Secret for enhanced security.
Secret: A resource used to store sensitive information, such as IP addresses or credentials, ensuring security and organization.
Enable to set up automatic incidents opening: Option that, when enabled, activates automatic incident creation upon detection of critical issues.
Severity: Level of criticality assigned to an incident, allowing it to be prioritized based on urgency.
Check Interval: Time interval, in seconds, for performing continuous checks on the monitored resource.
Maintenance Window: Feature that temporarily pauses monitoring, alerts, and notifications during planned maintenance periods.
Application Opening Hours: Configuration that defines the operating hours of the application, aligning monitoring with active periods and avoiding alerts outside those hours.
Last updated
Was this helpful?