

Azure Service Bus Monitor Configuration Guide on the Elven Platform
The Service Bus (Azure) Monitor from the Elven Platform enables checks based on key queries in Azure Service Bus queues or topics. This feature helps configure continuous monitoring, set up alerts, and define thresholds for automatic incident creation, ensuring you are quickly informed about any irregularities in connectivity or service performance.
Azure Service Bus is a messaging service managed by Microsoft Azure, designed to provide asynchronous and reliable communication between distributed systems. It facilitates message exchange between data producers and consumers, enabling the creation of scalable and resilient solutions. With support for queues, topics, and subscriptions, Service Bus is ideal for scenarios such as application integration, microservices architectures, and real-time event processing. Its managed infrastructure eliminates the need for queue setup and maintenance, simplifying the development of robust and efficient cloud-based systems.
Accessing Service Bus (Azure) Monitoring
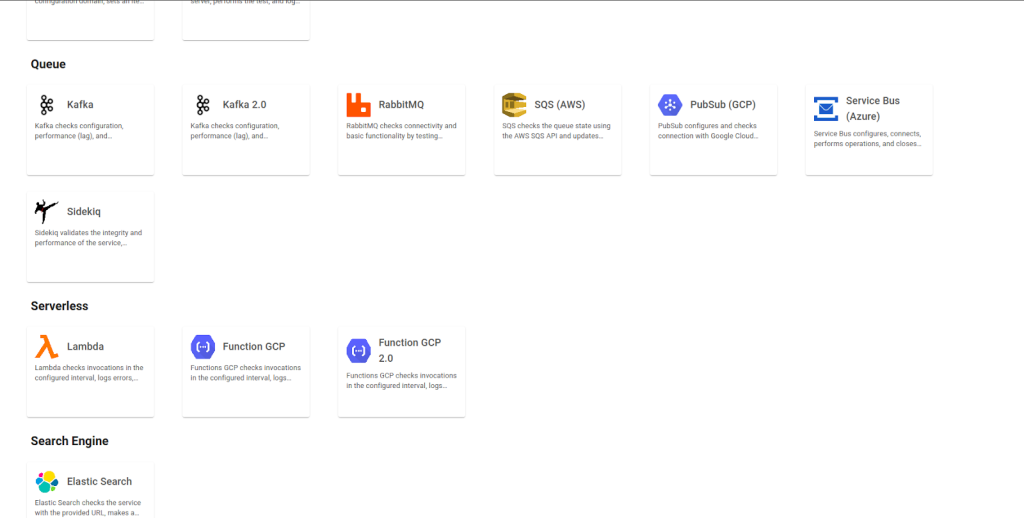
Navigate to the main menu and click on Services Hub.
In Queue, select the Service Bus (Azure) item.
Monitoring Configuration
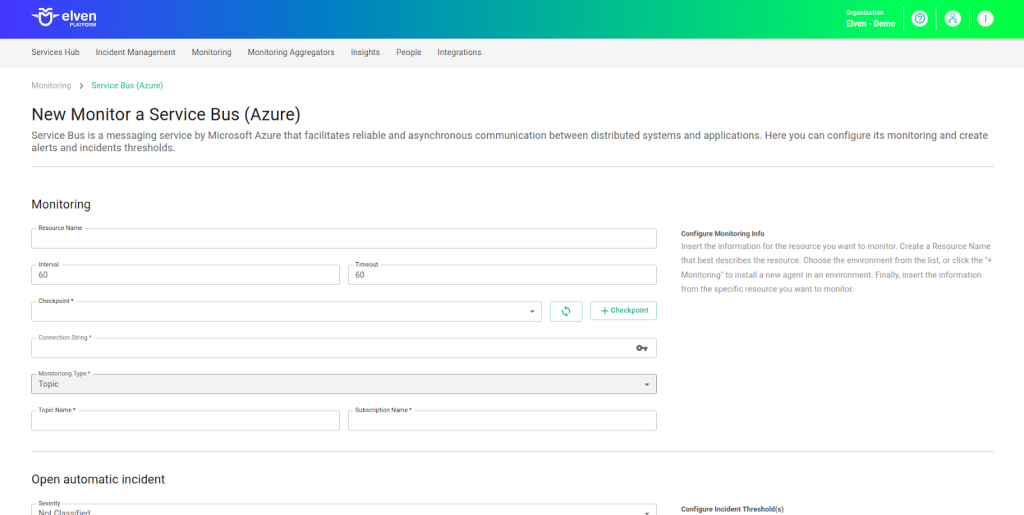
Monitoring the availability of your services has never been easier. Start by giving a clear name to the resource you want to track (Resource Name) to make identification easier. Then, adjust the interval between checks (Interval) and the timeout for responses (Timeout).
Select where the monitoring agent is located (Checkpoint Cloud) by choosing the appropriate Environment. If it doesn’t exist, you can create one using + Checkpoint.
After this setup, to start monitoring Azure Service Bus in the Elven Platform, simply fill in a few essential fields that will enable the connection and tracking of messages from your queue or topic. We’ll guide you through each of them in a simple and direct way.
Connection String is the starting point. Think of it as the address and key that allow the Elven Platform to connect to your Azure Service Bus namespace. Copy the Connection String directly from the Azure portal, where it is available under Shared Access Policies. Without it, the Elven Platform cannot “see” your queues or topics.
Next, choose the Monitoring Type: whether you want to monitor a Queue—ideal for processing messages sequentially with a single consumer—or a Topic, perfect for scenarios where multiple subscribers need to receive the messages. Depending on your choice, fill in the corresponding field: Queue Name, if using queues, or Topic Name and Subscription Name, if working with topics. These names must match exactly what is configured in your Azure Service Bus.
Monitoring Type: Queue

Monitoring Type: Topic
Automatic Incident Opening
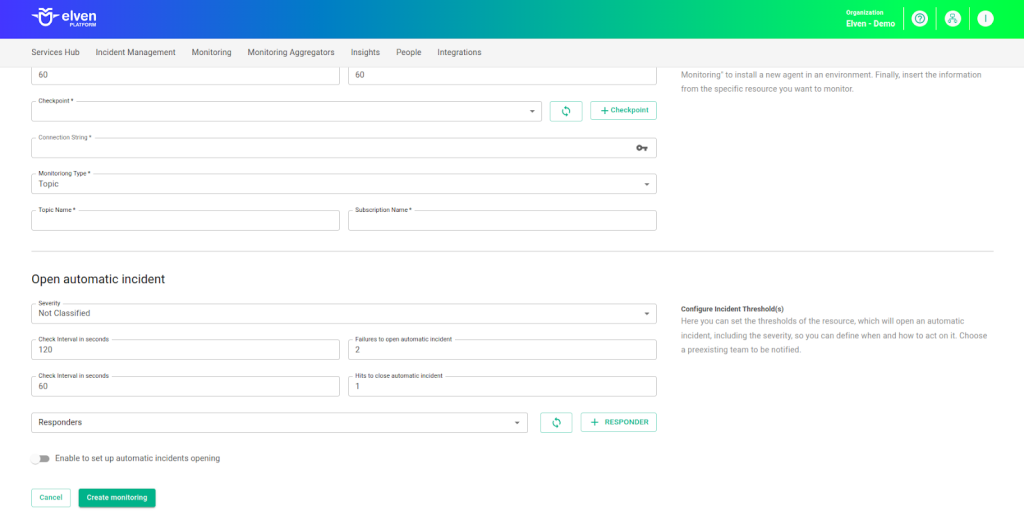
You can configure automatic incident opening to ensure a quick response to critical issues. To begin, define the incident severity, allowing you to prioritize according to urgency. Next, adjust the Check Interval, specifying the check frequency in seconds to continuously monitor the resource. This helps ensure you're always one step ahead, detecting problems as soon as they arise.
Additionally, select the team to be notified whenever an incident occurs and enable the "Enable to set up automatic incidents opening" option to ensure the configuration is active. With this setup, the platform automates incident management, making the response process faster and more efficient, without the need for manual intervention. This ensures your team is always ready to resolve any issue with speed and precision.
Maintenance Window
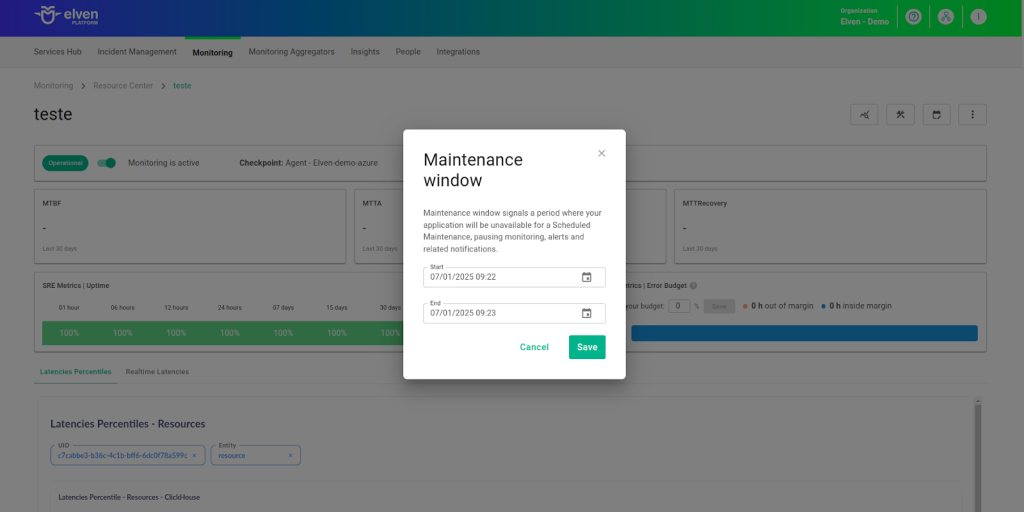
We also have the Maintenance Window, an essential feature for managing planned maintenance periods in your application. During this interval, checks are temporarily paused, preventing monitoring, alerts, and notifications from being triggered while you perform adjustments or updates. This allows maintenance to proceed smoothly, without generating unnecessary notifications or false alarms, ensuring your operations continue in an orderly fashion without unexpected interruptions in performance reports.
For example, imagine you need to update the payment system of an e-commerce platform, making backend adjustments such as installing new security certificates. To do this, you can configure a Maintenance Window for a specific time, such as 12/13/2024, from 14:00 to 14:30. During this period, the Elven Platform suspends checks, preventing the monitoring system from logging temporary failures or triggering false alerts. This way, you can make the necessary changes calmly, knowing that the monitoring system won’t be impacted during maintenance.
This approach ensures that the update is carried out in an organized manner, without affecting the user experience or generating unwanted notifications.
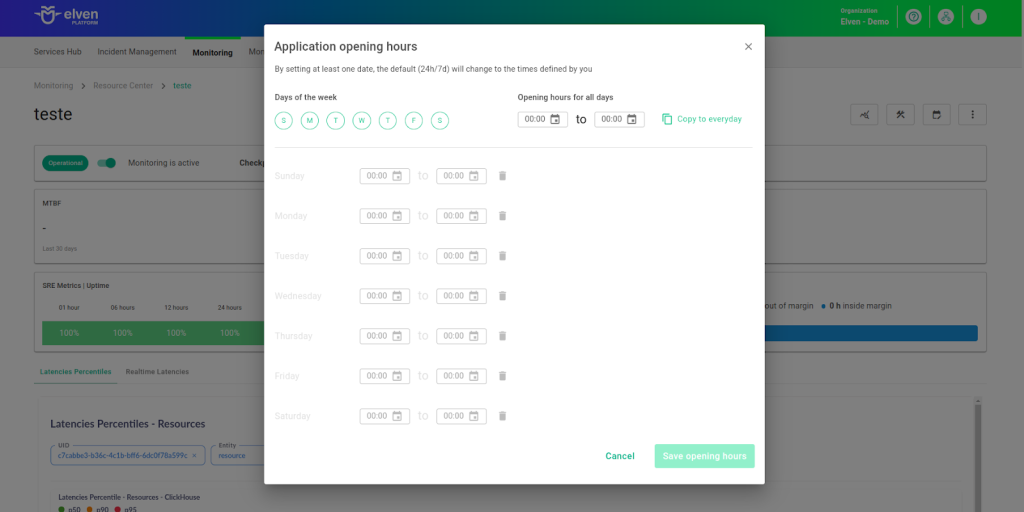
Application Opening Hours
You can also rely on the Application Opening Hours feature, which allows you to configure your application's operating schedule. This functionality is essential for customizing monitoring based on the periods when your application is actually active, avoiding alerts and notifications outside of business hours. This makes monitoring more aligned with your business’s real needs, ensuring more accurate reports and efficient management.
For example, imagine your application operates only from Monday to Friday, between 09:00 and 18:00. You can configure the Application Opening Hours to reflect this schedule by specifying the days and operating periods. With this setup, the Elven Platform automatically disables checks outside of these hours, preventing the logging of failures that don’t affect end users and avoiding unnecessary alerts.
This approach optimizes performance analysis, focusing only on relevant periods and providing a clearer view of your application's health during its active hours.
Glossary of Technical Terms
Azure Service Bus: A messaging service managed by Microsoft Azure, designed for asynchronous and reliable communication between distributed systems. It enables decoupling between message producers and consumers, ensuring ordered and secure delivery of data. It supports queues, topics, and subscriptions, and offers advanced features such as message scheduling, sessions for related messages, and transactional processing. Ideal for application integration, microservices architectures, and large-scale workflow management, with the convenience of a fully managed and highly scalable solution.
Interval: The time interval between automatic checks performed during monitoring.
Timeout: The maximum time allowed for the monitoring system to receive a response from the monitored resource before registering a failure.
Checkpoint Cloud: The location where the monitoring agent is deployed, which can be a pre-existing environment or one created by the user.
Connection String: A connection string that contains the Azure Service Bus namespace address, the Shared Access Policy, and the access key. It allows the Elven Platform to authenticate and connect to Azure Service Bus to monitor queues or topics.
Namespace: A logical container in Azure that groups queues, topics, and other Service Bus resources. It is the central point for sending and receiving messages.
Shared Access Policies: Settings in Azure Service Bus that define access permissions (such as send, receive, or manage messages) through access keys. Required to generate the Connection String used in the Elven Platform.
Queue: A messaging resource used to temporarily store messages until they are processed by a single consumer. Ideal for scenarios where messages must be processed sequentially.
Topic: A resource that allows multiple subscribers to receive published messages. Ideal for distributing messages to different consumers with specific needs.
Queue Name: The name assigned to the queue configured in Azure Service Bus. Required to identify which queue will be monitored by the Elven Platform.
Topic Name: The name assigned to the topic configured in Azure Service Bus. Required to identify which topic will be monitored by the Elven Platform.
Subscription Name: The name of a subscription associated with a topic, which filters or organizes the published messages. Required to monitor specific messages within a topic.
Enable to set up automatic incidents opening: An option that, when enabled, activates automatic incident creation upon detection of critical issues.
Severity: The level of criticality assigned to an incident, allowing it to be prioritized based on urgency.
Check Interval: The time interval, in seconds, for performing continuous checks on the monitored resource.
Maintenance Window: A feature that temporarily pauses monitoring, alerts, and notifications during planned maintenance periods.
Application Opening Hours: A configuration that defines the operating hours of the application, aligning monitoring with active periods and avoiding alerts outside those hours.
Last updated
Was this helpful?