

DynamoDB Database Monitor Configuration Guide on the Elven Platform
The DynamoDB Monitor from the Elven Platform enables checks based on key queries in DynamoDB. This feature helps configure continuous checks, define alerts, and set thresholds for automatic incident opening, ensuring you are quickly informed about any connectivity or performance issues.
DynamoDB is a NoSQL database managed by AWS, designed to handle applications that require high scalability, low latency, and consistent performance. It uses a table-based model, where data is organized as items and attributes, offering flexibility to store and query both structured and semi-structured data.
Widely used in scenarios such as e-commerce, gaming, mobile apps, and IoT, DynamoDB stands out for its ability to automatically scale to meet variable workloads while maintaining high availability and security. With features like global replication support, secondary indexes, TTL (time-to-live), and integration with other AWS services, DynamoDB is an ideal solution for modern applications that require fast and reliable processing of large volumes of distributed data.
Accessing DynamoDB Monitoring
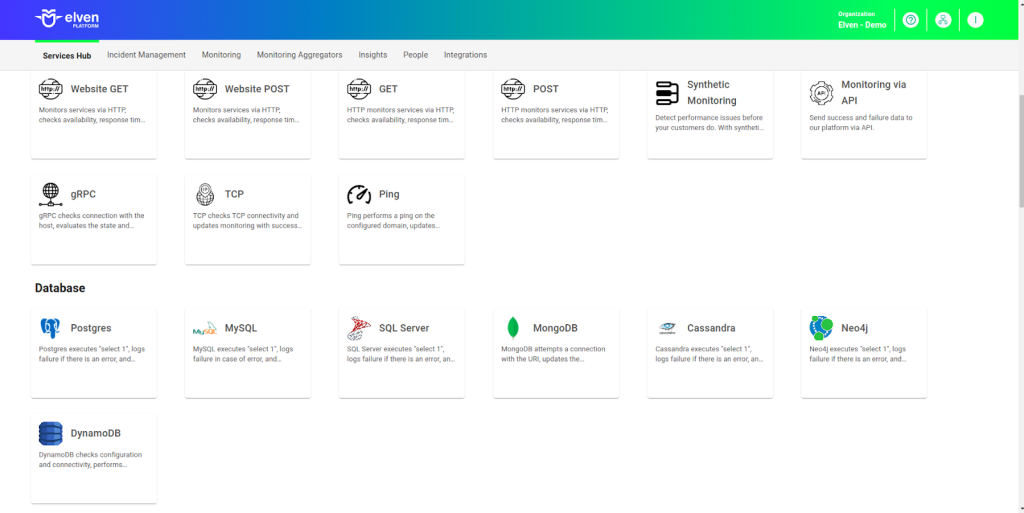
Navigate to the main menu and click on Services Hub.
Under Database, select the DynamoDB item.
Monitoring Configuration
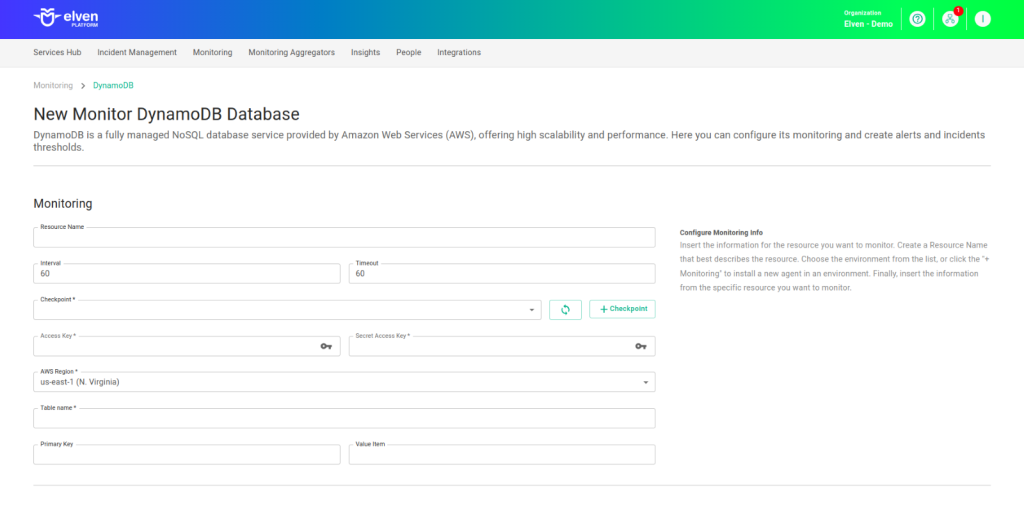
Monitoring the health of your services has never been more intuitive. Start by assigning a clear and descriptive Resource Name to the item you want to monitor, ensuring it is easy to locate and manage. Next, configure the Interval to define the frequency of checks, and adjust the Timeout to set the maximum response time, providing flexibility in monitoring.
Choose where the monitoring agent will be located (Checkpoint Cloud) by selecting an existing Environment or creating a new one by clicking + Checkpoint. Then, enter the Table Name you wish to monitor and configure the Primary Key along with its corresponding Value Item to track a specific item in the DynamoDB table.
Finish by adding the necessary access credentials. Fill in the Access Key and Secret Access Key fields with your AWS keys, which are required to authenticate and access the DynamoDB resource. Finally, choose the correct AWS Region to connect securely and efficiently to the DynamoDB resource.
Automatic Incident Opening
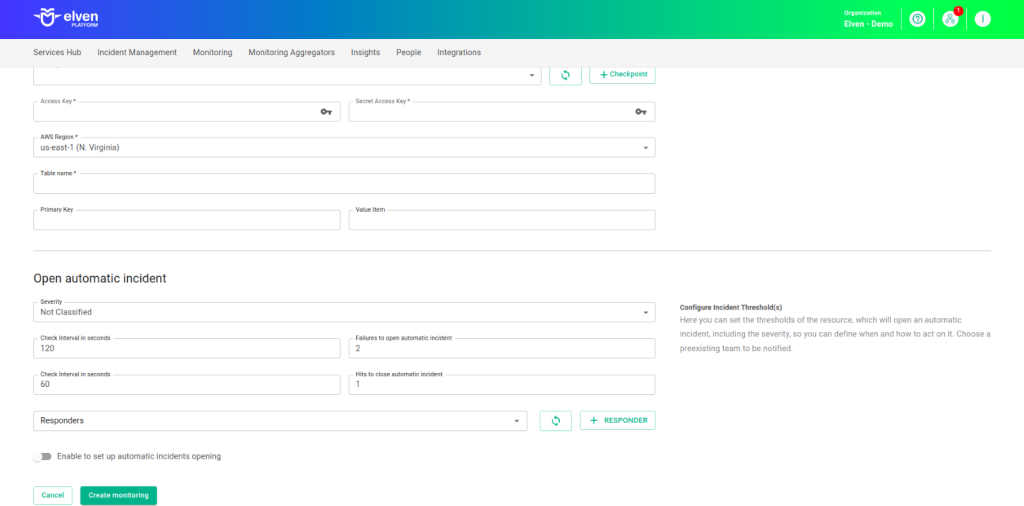
You can configure automatic incident opening to ensure a quick response to critical issues. To begin, define the incident severity, allowing you to prioritize according to urgency. Next, adjust the Check Interval, specifying the check frequency in seconds to continuously monitor the resource. This helps ensure you're always one step ahead, detecting problems as soon as they arise.
Additionally, select the team to be notified whenever an incident occurs and enable the "Enable to set up automatic incidents opening" option to ensure the configuration is active. With this setup, the platform automates incident management, making the response process faster and more efficient, without the need for manual intervention. This ensures your team is always ready to resolve any issue with speed and precision.
Maintenance Window
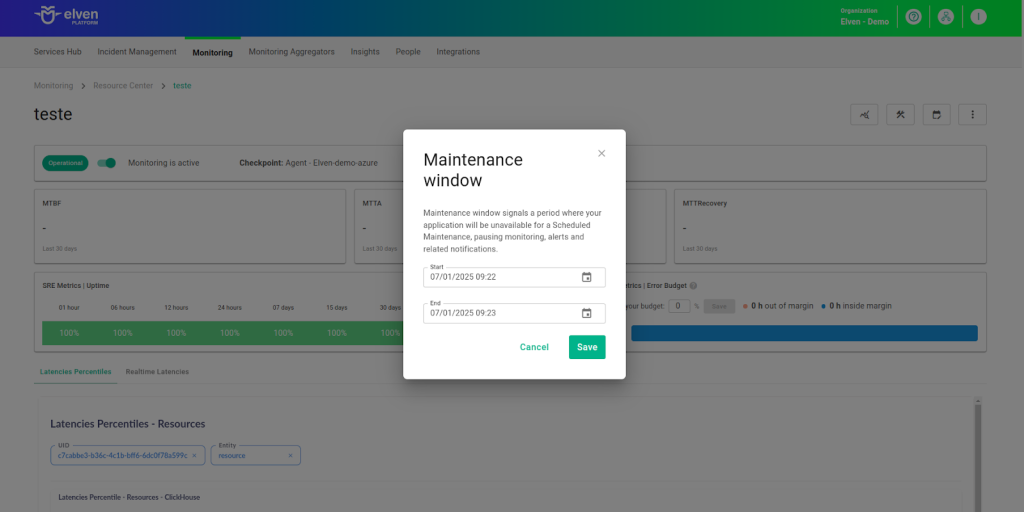
We also have the Maintenance Window, an essential feature for managing planned maintenance periods in your application. During this interval, checks are temporarily paused, preventing monitoring, alerts, and notifications from being triggered while you perform updates or adjustments. This allows maintenance to proceed smoothly, without generating unnecessary notifications or false alarms, ensuring your operation continues in an orderly manner without unexpected interruptions in performance reports.
For example, imagine you need to update the payment system of an e-commerce platform by making backend adjustments, such as installing new security certificates. To do this, you can configure the Maintenance Window for a specific time, such as 12/13/2024, from 2:00 PM to 2:30 PM. During this period, the Elven Platform suspends checks, preventing the monitoring system from recording temporary failures or triggering false alerts. This way, you can make the necessary changes calmly, knowing that the monitoring system will not be impacted during maintenance. This approach ensures that the update is carried out in an organized manner, without affecting the user experience or generating unwanted notifications.
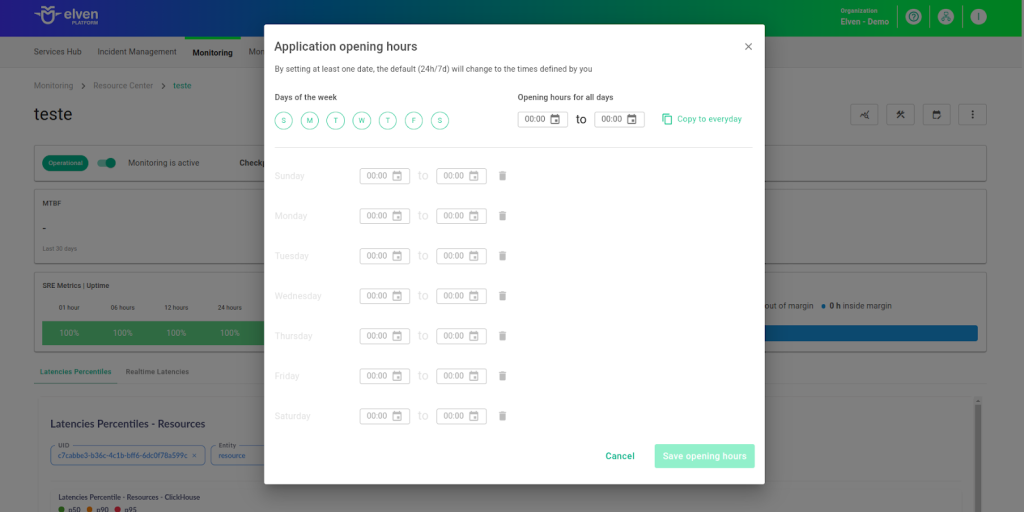
Application Opening Hours
You can also rely on the Application Opening Hours feature, which allows you to configure your application's operating hours. This functionality is essential for customizing monitoring based on the periods when your application is actually active, avoiding alerts and notifications outside of business hours. This makes monitoring more aligned with your business's real needs, ensuring more accurate reports and efficient management.
For example, imagine your application operates only from Monday to Friday, from 9:00 AM to 6:00 PM. You can configure Application Opening Hours to reflect this schedule by specifying the days and time periods of operation. With this setup, the Elven Platform automatically disables checks outside these hours, preventing the logging of failures that do not affect end users and avoiding unnecessary alerts. This approach optimizes performance analysis, focusing only on relevant periods and providing a clearer view of your application's health during its operating hours.
Glossary of Technical Terms
DynamoDB: A fully managed NoSQL database by AWS, designed to deliver fast performance and automatic scalability. It uses a table-based model that allows storing and accessing structured and semi-structured data with low latency, even at large scale. Ideal for use cases such as web applications, e-commerce, gaming, and IoT, DynamoDB is known for its high availability, global replication support, and ability to handle large volumes of data efficiently. Its integration with other AWS services makes it a powerful choice for modern, distributed applications.
Interval: The time interval between automatic checks performed during monitoring.
Timeout: The maximum time allowed for the monitoring system to receive a response from the monitored resource before registering a failure.
Checkpoint Cloud: The location where the monitoring agent is hosted, which can be a pre-existing environment or one created by the user.
Host: The URL address of the monitored resource. If an IP address is required, it should be stored in a Secret for enhanced security.
Secret: A resource used to store sensitive information, such as IP addresses or credentials, ensuring security and organization.
Access Key: A field to enter your AWS access key. This key is part of the credentials required to authenticate and access the DynamoDB resource.
Secret Access Key: A field to enter the secret key associated with the Access Key. Together, these keys authenticate your account and provide access to DynamoDB.
AWS Region: A dropdown list where you select the AWS region in which your DynamoDB resource is hosted.
Table Name: A field to enter the name of the DynamoDB table you want to monitor. This is the main identifier used to link monitoring to a specific table.
Primary Key: A field to specify the primary key of the DynamoDB table. The primary key is essential for identifying unique items in the table.
Value Item: A field where you enter the value associated with the primary key that will be used in monitoring. This helps locate a specific item within the table.
Enable to set up automatic incidents opening: An option that, when enabled, allows the automatic creation of incidents upon detection of critical issues.
Severity: The level of criticality assigned to an incident, allowing it to be prioritized based on urgency.
Check Interval: The time interval, in seconds, for performing continuous checks on the monitored resource.
Maintenance Window: A feature that temporarily pauses monitoring, alerts, and notifications during planned maintenance periods.
Application Opening Hours: A configuration that defines the operating hours of the application, aligning monitoring with active periods and avoiding alerts outside those hours.
Last updated
Was this helpful?