

Kafka Queue Monitor Configuration Guide on the Elven Platform
The Kafka Monitor from the Elven Platform enables checks based on key queries in Kafka. This feature helps configure continuous checks, set alerts, and define thresholds for automatic incident creation, ensuring you are promptly informed of any irregularities in connectivity or service performance.
Apache Kafka is an open-source distributed streaming platform designed for real-time data stream processing and integration. It operates both as a pub/sub messaging system and a distributed log storage system, allowing the transport of large volumes of data with high resilience and low latency. Kafka organizes data into topics, which can be consumed by multiple clients simultaneously, ensuring horizontal scalability. Its ability to handle millions of messages per second makes it ideal for applications such as real-time event analysis, data pipelines, system integrations, and microservices-based solutions.
Accessing Kafka Monitoring
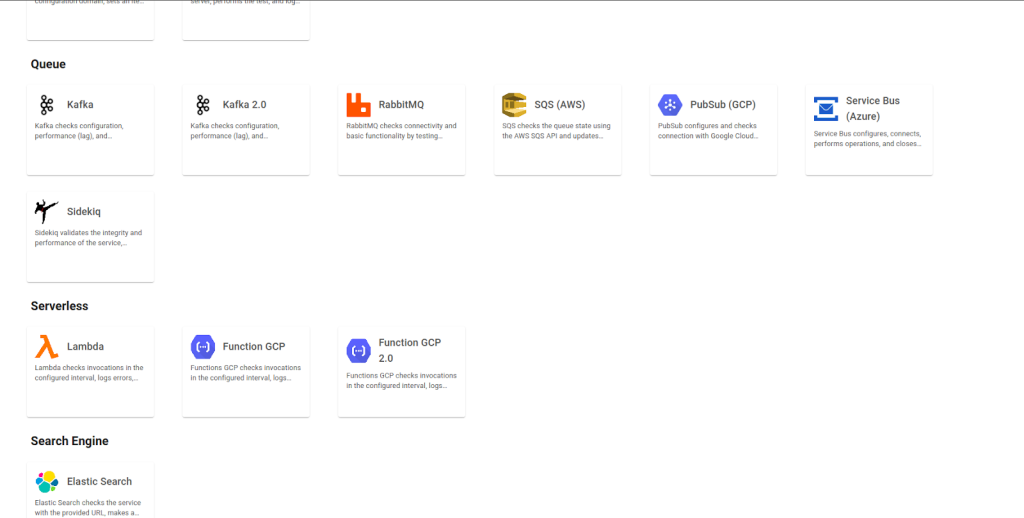
Navigate to the main menu and click on Services Hub.
In Queue, select the Kafka item.
Monitor Configuration
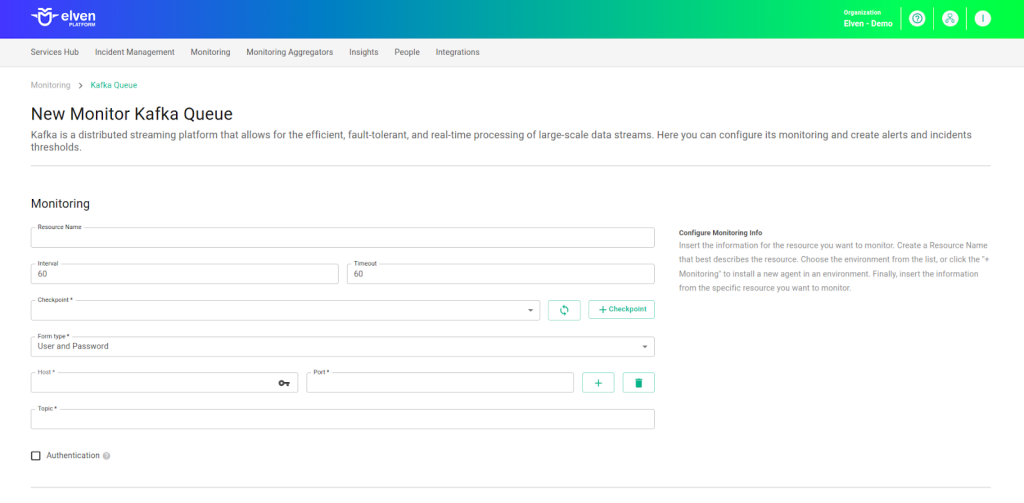
Monitoring the availability of your services has never been easier. Start by giving a clear name to the resource you want to monitor (Resource Name) to make identification easier. Then, adjust the interval between checks (Interval) and the response timeout (Timeout).
Select where the monitoring agent is located (Checkpoint Cloud) by choosing the Environment. If it doesn’t exist, you can create one using + Checkpoint. After this setup, in Form Type, you can choose between User and Password or Healthcheck URL.
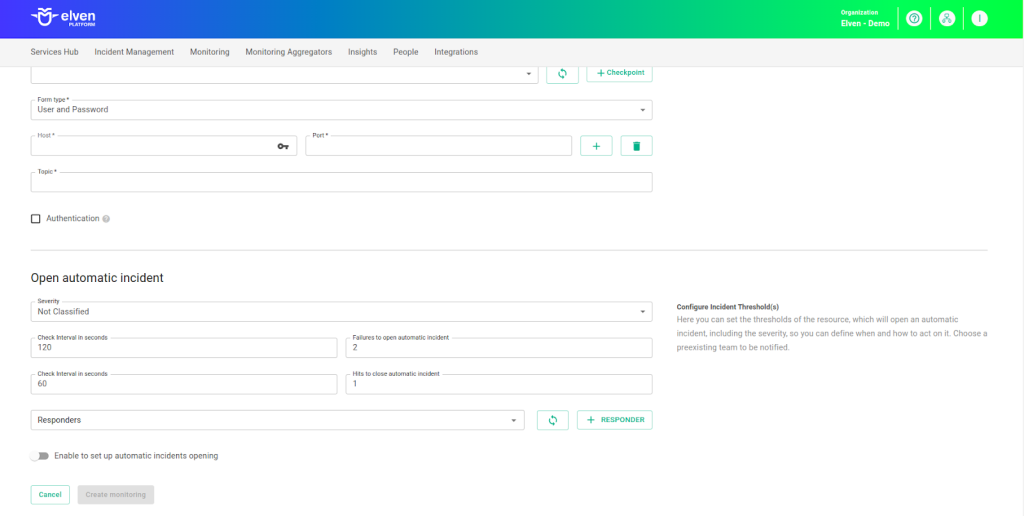
In User and Password, you must provide the server address in the Host field, the Port, and the Topic (the name of the Kafka topic you want to monitor or interact with). In Healthcheck URL, you can simply enter the URL of the resource to be monitored.
Remember that the Host and Healthcheck URL fields only accept URLs; if you need to use an IP address, it must be created as a secret to ensure the security and organization of the information.
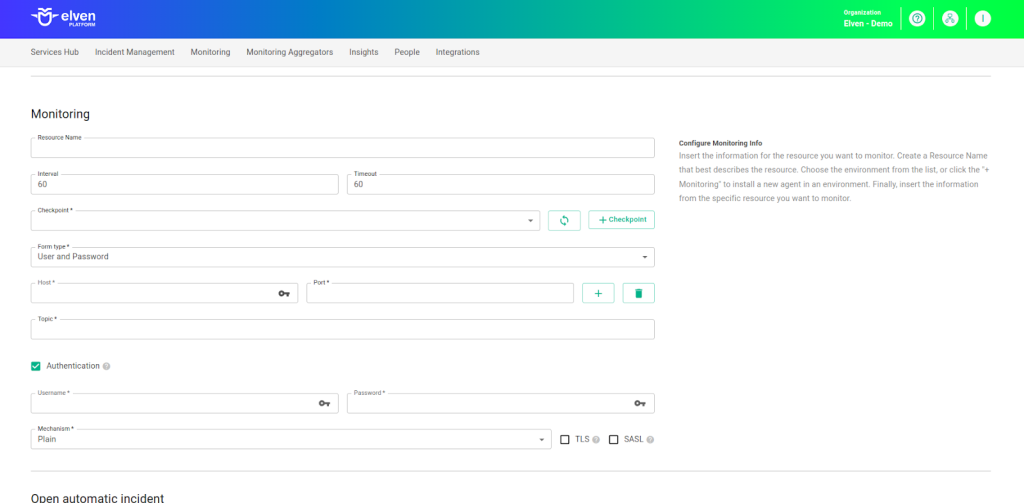
If authentication is required in Kafka, check the Authentication option and fill in the fields according to the security mechanism implemented by the cluster. The first step is to enter the username in the Username field and the corresponding password in the Password field. These values are provided by the Kafka administrator and are used to authenticate the client. Then, in the Mechanism field, select the authentication mechanism used by the Kafka broker.
If the cluster uses a simple method like PLAIN, you only need to provide the username and password. For more secure configurations like SCRAM, Kafka performs authentication based on hashed passwords, offering greater protection. If the cluster uses OAuth, authentication is done using OAuth 2.0 tokens, allowing secure integration with identity providers. In the case of GSSAPI, the mechanism uses the Kerberos protocol for authentication, providing a robust solution widely used in enterprise environments.
Additionally, it’s important to check whether Kafka is configured to use TLS or SASL. If the cluster implements encryption to ensure secure communication, check the TLS option to enable this protection layer. If Kafka uses an additional authentication layer like SASL, also check the corresponding box.
Configuration with User and Password
Configuration with User and Password and Authentication
Configuration with Healthcheck URL
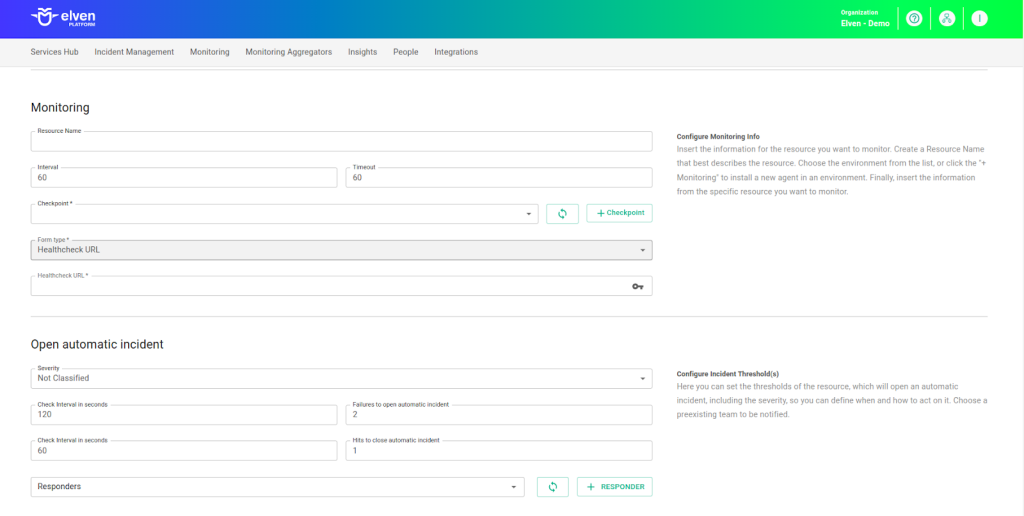
Automatic Incident Opening
You can configure automatic incident opening to ensure a quick response to critical issues. To begin, define the incident severity, allowing you to prioritize according to urgency. Next, adjust the Check Interval, specifying the check frequency in seconds to continuously monitor the resource. This helps ensure you're always one step ahead, detecting problems as soon as they arise.
Additionally, select the team to be notified whenever an incident occurs and enable the "Enable to set up automatic incidents opening" option to ensure the configuration is active. With this setup, the platform automates incident management, making the response process faster and more efficient, without the need for manual intervention. This ensures your team is always ready to resolve any issue with speed and precision.
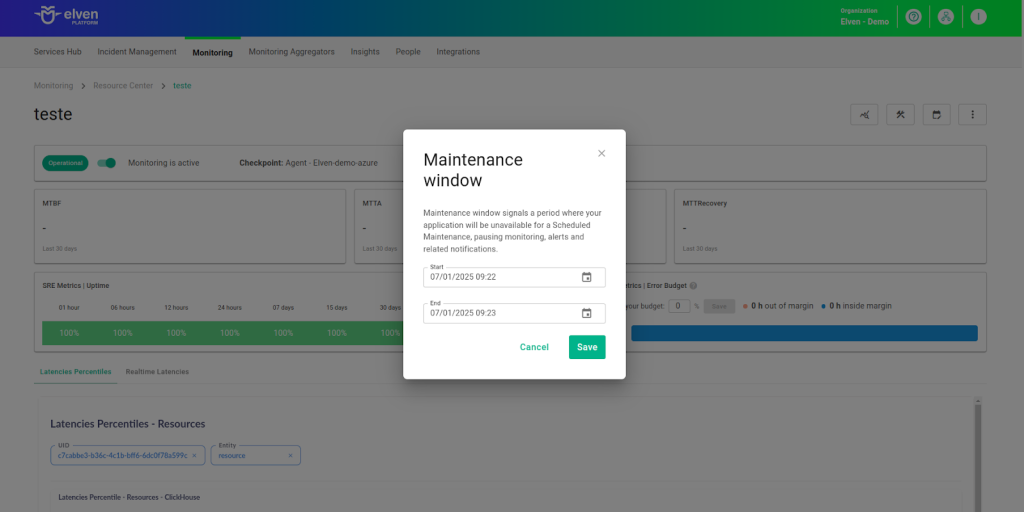
Maintenance Window
Maintenance Window is an essential feature for managing planned maintenance periods in your application. During this time frame, checks are temporarily paused, preventing monitoring, alerts, and notifications from being triggered while you perform adjustments or updates. This allows maintenance to proceed smoothly, without generating unnecessary notifications or false alarms, ensuring your operations continue in an orderly manner without unexpected interruptions in performance reports.
For example, imagine you need to update the payment system of an e-commerce platform, making backend adjustments such as installing new security certificates. To do this, you can configure a Maintenance Window for a specific time, such as 12/13/2024, from 2:00 PM to 2:30 PM. During this period, the Elven Platform suspends checks, preventing the monitoring system from logging temporary failures or triggering false alerts. This way, you can make the necessary changes calmly, knowing that the monitoring system will not be affected during maintenance.
This approach ensures that updates are carried out in an organized manner, without affecting the user experience or generating unwanted notifications.
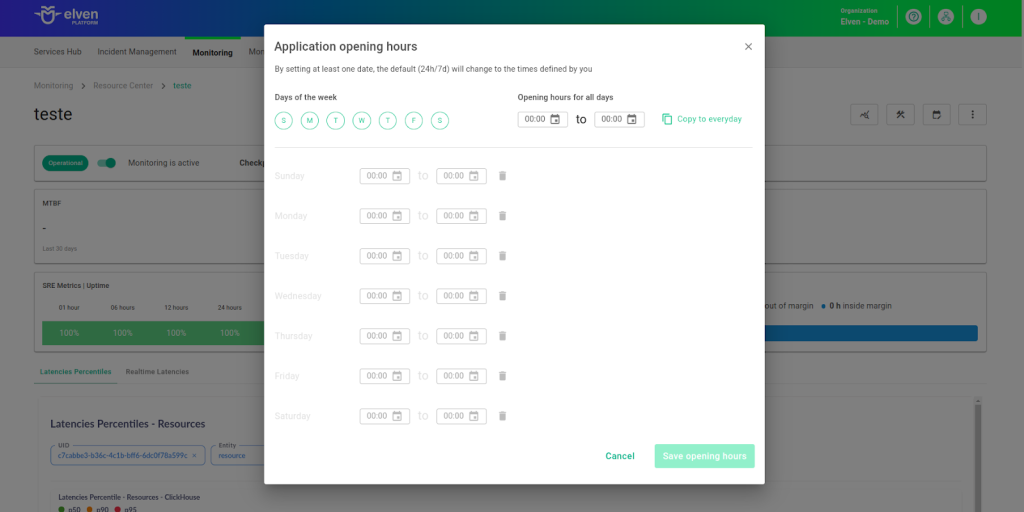
Application Opening Hours
You can also rely on the Application Opening Hours feature, which allows you to configure your application's operating hours. This functionality is essential for customizing monitoring based on the periods when your application is actually active, avoiding alerts and notifications outside of business hours. This makes monitoring more aligned with your business's real needs, ensuring more accurate reports and efficient management.
For example, imagine your application operates only from Monday to Friday, between 9:00 AM and 6:00 PM. You can configure Application Opening Hours to reflect this schedule by specifying the days and operating periods. With this setup, the Elven Platform automatically disables checks outside these hours, preventing the logging of failures that don’t affect end users and avoiding unnecessary alerts.
This approach optimizes performance analysis, focusing only on relevant periods and providing a clearer view of your application's health during its operational hours.
Glossary of Technical Terms
Kafka: An open-source event streaming platform designed to process, store, and transmit large volumes of data in real time. With support for publish-subscribe patterns, distributed queues, and durable storage, it offers high scalability, low latency, and high availability. Ideal for applications requiring continuous data processing, such as system integration, real-time analytics, and monitoring. Compatible with various programming languages, it is widely used in microservices architectures and modern data pipelines.
Interval: The time interval between automatic checks performed during monitoring.
Timeout: The maximum time allowed for the monitoring system to receive a response from the monitored resource before registering a failure.
Checkpoint Cloud: The location of the monitoring agent, which can be a preexisting environment or one created by the user.
Host: The URL address of the monitored resource. If an IP address is required, it must be stored in a Secret for enhanced security.
Port: The access port for Kafka.
Secret: A resource used to store sensitive information, such as IP addresses or credentials, ensuring security and organization.
Username: A unique identifier configured in the Kafka broker to authenticate a client's access to the cluster.
Password: The credential associated with the username, used for authentication and authorization in Kafka.
Mechanism: The authentication method used by Kafka, selected in the form. Examples include:
PLAIN: A simple method using username and password for authentication.
SCRAM (Salted Challenge Response Authentication Mechanism): A more secure mechanism using hashed passwords for authentication.
OAUTHBEARER: Uses OAuth 2.0 tokens for authentication, allowing integration with identity providers.
GSSAPI (Generic Security Service Application Program Interface): Kerberos-based authentication, widely used in enterprise environments.
TLS (Transport Layer Security): An encryption protocol that secures communication between the Kafka client and server, ensuring data confidentiality.
SASL (Simple Authentication and Security Layer): An authentication layer supporting various mechanisms (such as PLAIN, SCRAM, OAUTHBEARER, and GSSAPI) for secure authentication in Kafka.
Kafka Broker: A component of a Kafka cluster responsible for storing and distributing messages between producers and consumers.
Kafka Cluster: A group of Kafka brokers working together to manage and process messages in a distributed and scalable manner.
Enable to set up automatic incidents opening: An option that, when enabled, activates automatic incident creation upon detection of critical issues.
Severity: The level of criticality assigned to an incident, allowing it to be prioritized based on urgency.
Check Interval: The time interval, in seconds, for performing continuous checks on the monitored resource.
Maintenance Window: A feature that temporarily pauses monitoring, alerts, and notifications during planned maintenance periods.
Application Opening Hours: A configuration that defines the operating hours of the application, aligning monitoring with active periods and avoiding alerts outside those hours.
Last updated
Was this helpful?