

RabbitMQ Queue Monitor Configuration Guide on the Elven Platform
The RabbitMQ Monitor from the Elven Platform enables checks based on key queries in RabbitMQ. This feature helps configure continuous checks, set alerts, and define thresholds for automatic incident creation, ensuring you are quickly informed about any irregularities in connectivity or service performance.
RabbitMQ is an open-source messaging platform designed for message exchange between distributed systems. It follows the message queue model and supports various communication protocols such as AMQP, MQTT, and STOMP. RabbitMQ is used to manage communication between system components, allowing for the sending, receiving, and routing of messages in a reliable and efficient manner. It organizes messages into queues, enabling consumers to process them asynchronously and at scale. With support for high availability, clustering, and load balancing, RabbitMQ is ideal for scenarios requiring robust and fault-tolerant communication, such as system integration, microservices, and background task processing.
How the Elven Platform monitors RabbitMQ:
The RabbitMQ monitoring feature performs the following steps:
Establishes a connection with RabbitMQ.
Creates a queue named “1p-checker”.
Publishes a “ping” message to the queue.
Registers itself as a consumer of that queue.
Consumes the posted message.
Accessing RabbitMQ Monitoring
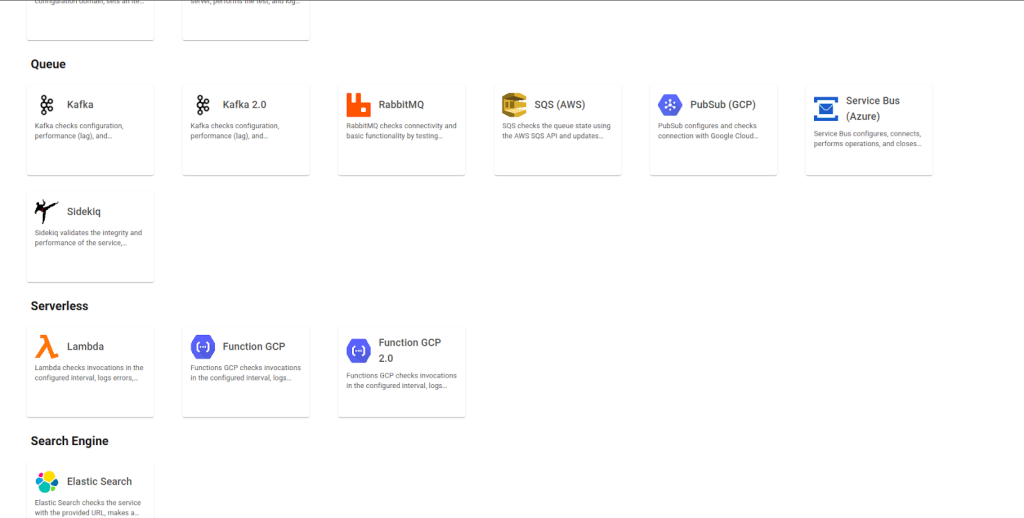
Navigate to the main menu and click on Services Hub.
In Queue, select the item RabbitMQ.
Monitoring Configuration
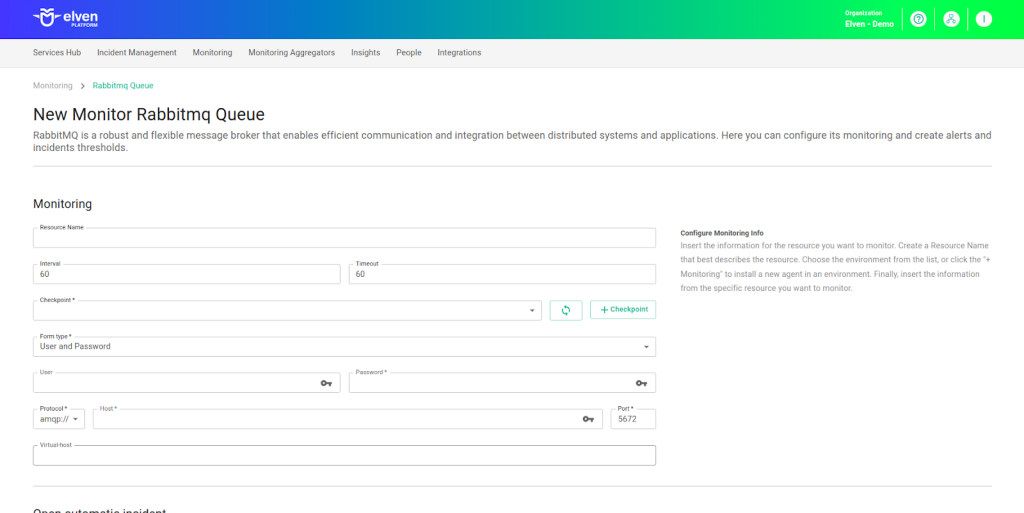
Monitoring your service availability has never been easier. Start by giving a clear name to the resource you want to monitor (Resource Name) to make identification easier. Then, adjust the Interval between checks and the Timeout for responses.
Select where the monitoring agent is located (Checkpoint Cloud) by choosing an Environment. If one doesn’t exist, you can create it by clicking + Checkpoint. After this setup, in Form Type, you can choose between User and Password or Healthcheck URL.
If you select User and Password, enter the username in the Username field and the corresponding password in the Password field. Then, provide the server address in the Protocol, Host, and Port fields. The default port is 5674, but it can be adjusted if the service is configured on a different port.
When configuring your connection to RabbitMQ, you’ll see two protocol options: amqp:// and amqps://. The first, amqp://, is the default protocol used for communication between the client and the RabbitMQ server, but it does not offer encryption, meaning data exchange is not protected. On the other hand, amqps:// provides an extra layer of security by using SSL/TLS to encrypt communication. This ensures that data exchanged between the client and server is protected from potential interception.
Additionally, to ensure effective RabbitMQ monitoring, it’s important to correctly fill in the Virtual Host (vhost) field. The vhost in RabbitMQ is a way to organize and isolate different applications or systems within the same server. Each vhost has its own queues, exchanges, and permissions, allowing you to keep communication between different systems well-organized and secure. By specifying the vhost, you direct monitoring to a specific space, making it easier to analyze queues and exchanges more accurately. Filling in this field correctly helps ensure clearer and more efficient control over operations, especially in environments with multiple applications or clients.
In the case of Healthcheck URL, you can enter only the URL of the resource to be monitored. Remember that the Host and Healthcheck URL fields accept only URLs; if you need to use an IP address, it must be stored in a secret to ensure the security and organization of the information.
Automatic Incident Opening
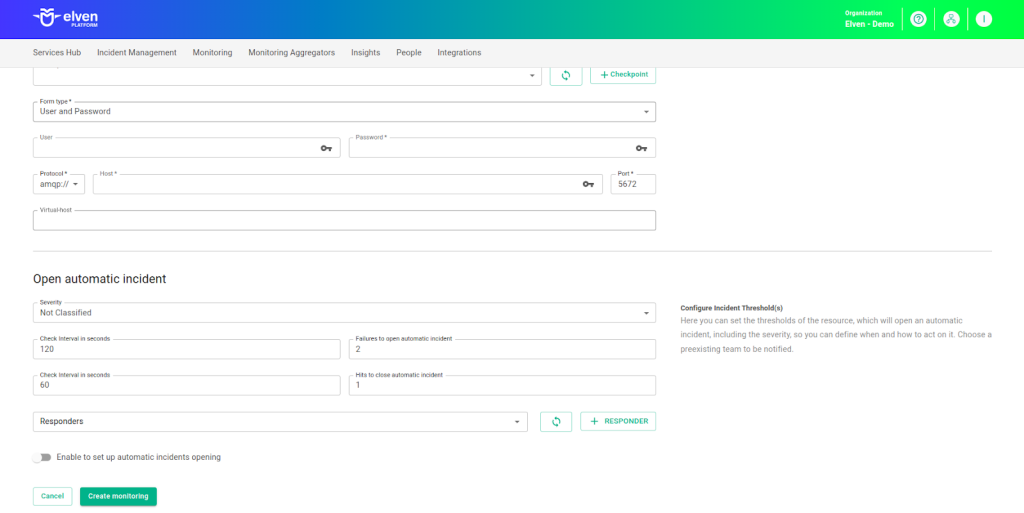
You can configure automatic incident opening to ensure a quick response to critical issues. To begin, define the incident severity, allowing you to prioritize according to urgency. Next, adjust the Check Interval, specifying the check frequency in seconds to continuously monitor the resource. This helps ensure you're always one step ahead, detecting problems as soon as they arise.
Additionally, select the team to be notified whenever an incident occurs and enable the "Enable to set up automatic incidents opening" option to ensure the configuration is active. With this setup, the platform automates incident management, making the response process faster and more efficient, without the need for manual intervention. This ensures your team is always ready to resolve any issue with speed and precision.
Maintenance Window
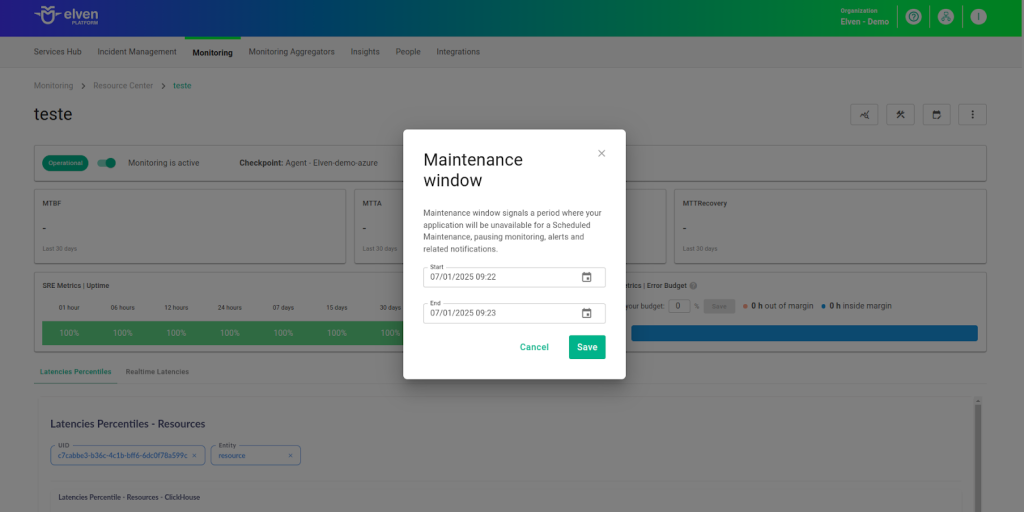
We also have the Maintenance Window, an essential feature for managing planned maintenance periods in your application. During this interval, checks are temporarily paused, preventing monitoring, alerts, and notifications from being triggered while you perform adjustments or updates. This allows maintenance to proceed smoothly, without generating unnecessary notifications or false alarms, ensuring your operations continue in an orderly fashion without unexpected interruptions in performance reports.
For example, imagine you need to update the payment system of an e-commerce platform, making backend adjustments such as installing new security certificates. To do this, you can configure the Maintenance Window for a specific time, such as 12/13/2024, from 2:00 PM to 2:30 PM. During this period, the Elven Platform suspends checks, preventing the monitoring system from registering temporary failures or triggering false alerts. This way, you can make the necessary changes calmly, knowing that the monitoring system will not be impacted during maintenance.
This approach ensures that the update is carried out in an organized manner, without affecting the user experience or generating unwanted notifications.
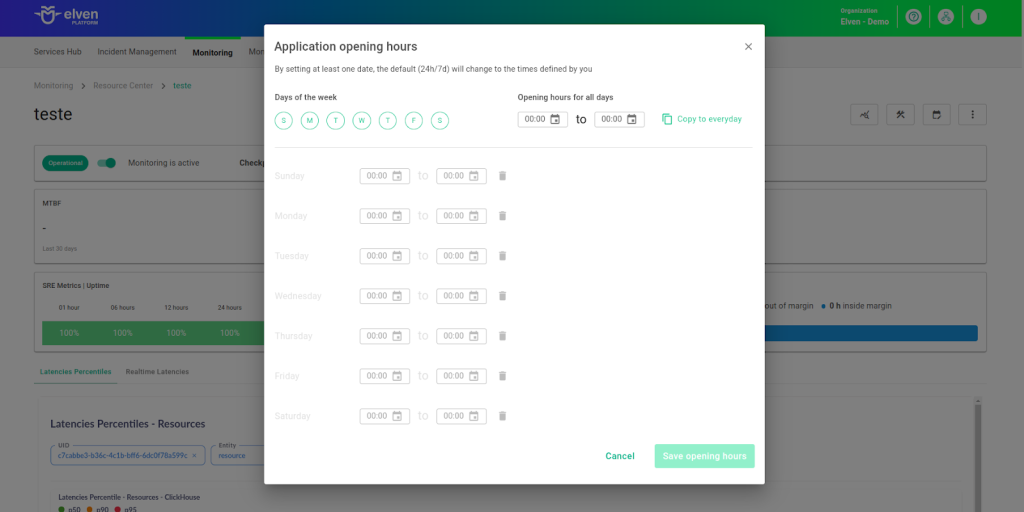
Application Opening Hours
You can also rely on the Application Opening Hours feature, which allows you to configure your application's operating hours. This functionality is essential for customizing monitoring based on the periods when your application is actually active, avoiding alerts and notifications outside of business hours. This way, monitoring becomes more aligned with your business’s real needs, ensuring more accurate reports and efficient management.
For example, imagine your application operates only from Monday to Friday, between 9:00 AM and 6:00 PM. You can configure the Application Opening Hours to reflect this schedule by specifying the days and operating periods. With this setup, the Elven Platform automatically disables checks outside of these hours, preventing the logging of failures that don’t affect end users and avoiding unnecessary alerts.
This approach optimizes performance analysis, focusing only on relevant periods and providing a clearer view of your application's health during its operating hours.
Glossary of Technical Terms
RabbitMQ: An open-source messaging platform based on message queues, used for asynchronous and reliable communication between distributed systems. Supports multiple protocols such as AMQP and MQTT, offering high flexibility, scalability, and availability. Ideal for system integration, microservices, and background task processing.
Interval: Time interval between automatic checks performed during monitoring.
Timeout: Maximum time allowed for monitoring to receive a response from the monitored resource before registering a failure.
Checkpoint Cloud: Location where the monitoring agent is hosted, which can be a preexisting environment or one created by the user.
Host: URL address of the monitored resource. If an IP address is needed, it must be stored in a Secret for enhanced security.
Secret: Resource used to store sensitive information, such as IP addresses or credentials, ensuring security and organization.
Username: Field where the username is entered for authentication in RabbitMQ.
Password: Field where the password corresponding to the username is entered for authentication in RabbitMQ.
Protocol: Communication protocol used to connect to RabbitMQ. Can be configured as amqp:// (unencrypted) or amqps:// (encrypted with SSL/TLS).
Host: Server address where RabbitMQ is hosted. This field must be filled with the server address to establish the connection.
Port: Communication port for connecting to RabbitMQ. The default value is 5674, but it can be adjusted if the service is configured on a different port.
Virtual Host (vhost): Isolated space within RabbitMQ used to organize and manage queues, exchanges, and permissions. It allows control over communication between different applications or systems within the same server.
amqp://: Default communication protocol without encryption for connecting to RabbitMQ.
amqps://: Communication protocol that adds a layer of security using SSL/TLS, ensuring data encryption during communication with RabbitMQ.
Healthcheck URL: URL used to check the health of the RabbitMQ server, an alternative method for authentication and monitoring.
Enable to set up automatic incidents opening: Option that, when enabled, activates automatic incident creation upon detection of critical issues.
Severity: Level of criticality assigned to an incident, allowing it to be prioritized according to urgency.
Check Interval: Time interval, in seconds, for performing continuous checks on the monitored resource.
Maintenance Window: Feature that temporarily pauses monitoring, alerts, and notifications during planned maintenance periods.
Application Opening Hours: Configuration that defines the operating hours of the application, aligning monitoring with active periods and avoiding alerts outside those hours.
Last updated
Was this helpful?