

Guide for Configuring the External Service Incident CloudWatch on the Elven Platform
The integration of the External Service Incident CloudWatch with the Elven Platform is a solution designed to simplify your life by centralizing incident management in a single place. With it, you receive notifications directly from Amazon CloudWatch, eliminating the need to switch between platforms and allowing a clear and efficient view of everything happening in your work environment.
In addition, the integration is fully customizable. You define which metrics and conditions are most relevant to your business, ensuring that the incident notifications you receive are useful and aligned with your needs. It’s a practical way to turn monitoring into a more fluid, organized, and accurate experience.
API Token Configuration
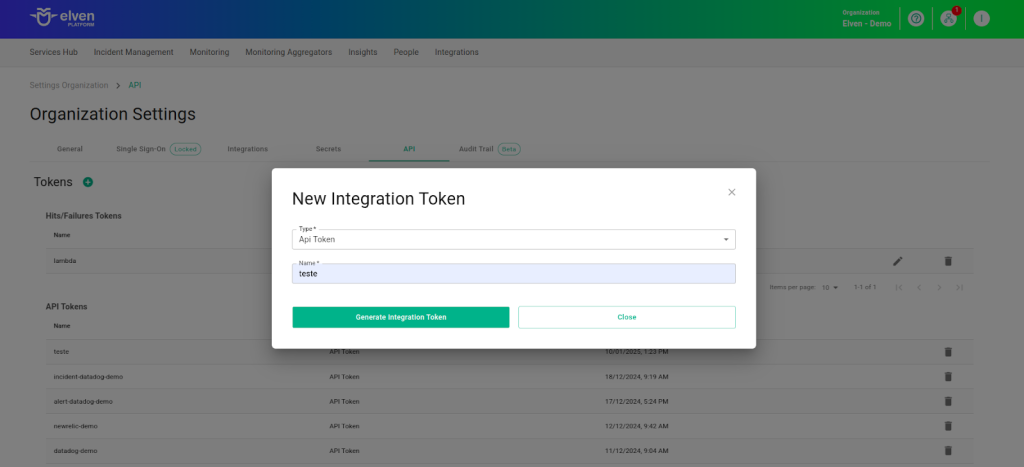
To configure the External Service Incident in CloudWatch, it is necessary to generate an API Token. This token will be used as an essential part of the authentication process, being incorporated directly into the request Path. It acts as an additional layer of security, ensuring that only properly authorized users can access and interact with the external service. In this context, the API Token is included as a URL parameter in the call to the API. This ensures that client authentication is correctly performed during the sending of incident notifications or interaction with the service.
In the top menu, under your user configuration section, click on Organization Settings.
In the API tab, click the + button to create a new API Token.
Accessing External Service Incident CloudWatch
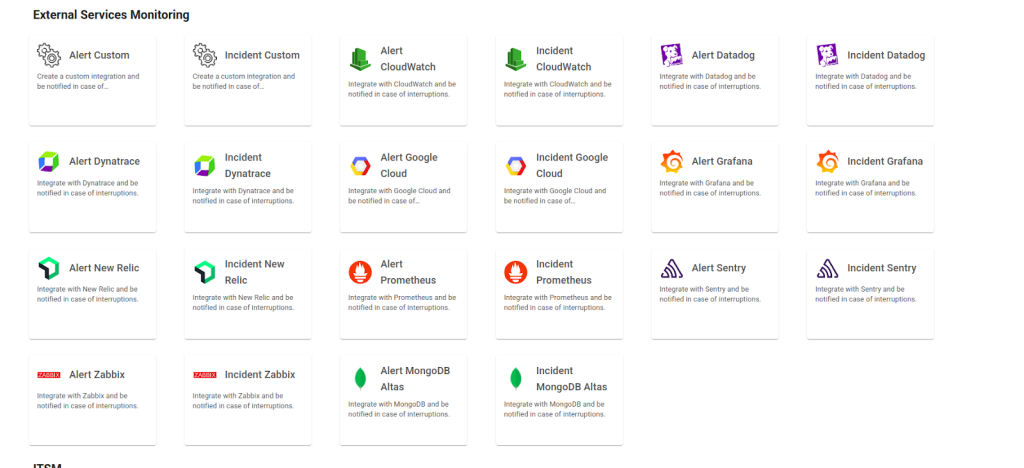
Navigate to the main menu and click on Services Hub.
In External Services Monitoring, select the Incident CloudWatch item.
External Service Incident CloudWatch Configuration
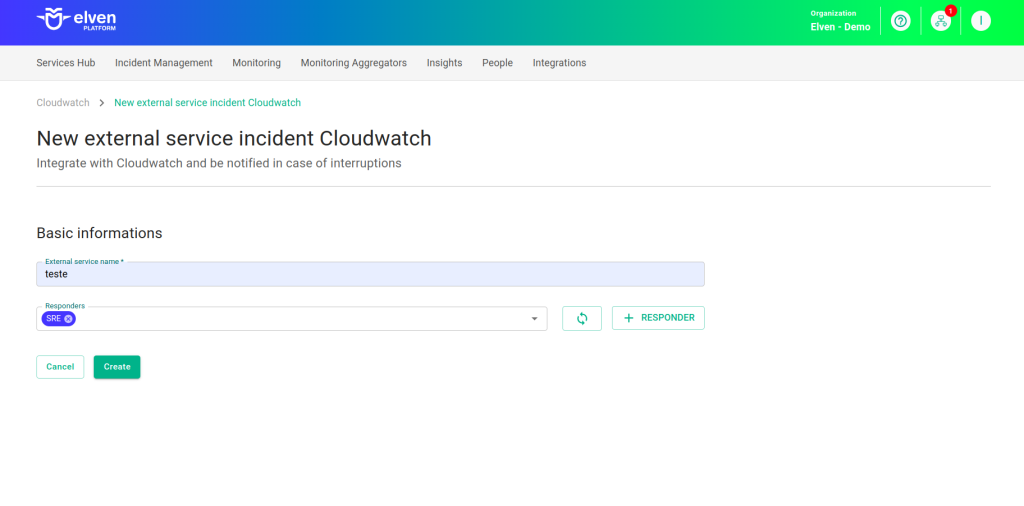
The configuration of the fields in External Service Incident CloudWatch is an essential step to ensure that your incident notifications on the Elven Platform work efficiently and reach the right people at the right time. The first field, External Service Name, is where you should assign a name to the service being integrated. This name will appear in dashboards and reports, making it easier to quickly identify the service among others. Choose a clear and descriptive name, as it will be your reference for managing and reviewing the incident history in the future.
The Responders field is the bridge between the incident and its resolution. Here you define who will be notified when the incident notification is triggered, whether specific individuals, entire teams, or even automated systems. This field is vital to ensure that incident notifications reach the right people, avoiding delays and confusion. Add relevant contacts, such as emails or team IDs, and make sure all responsible parties have the necessary information and access to act quickly.
Lambda Function of the External Service Incident CloudWatch
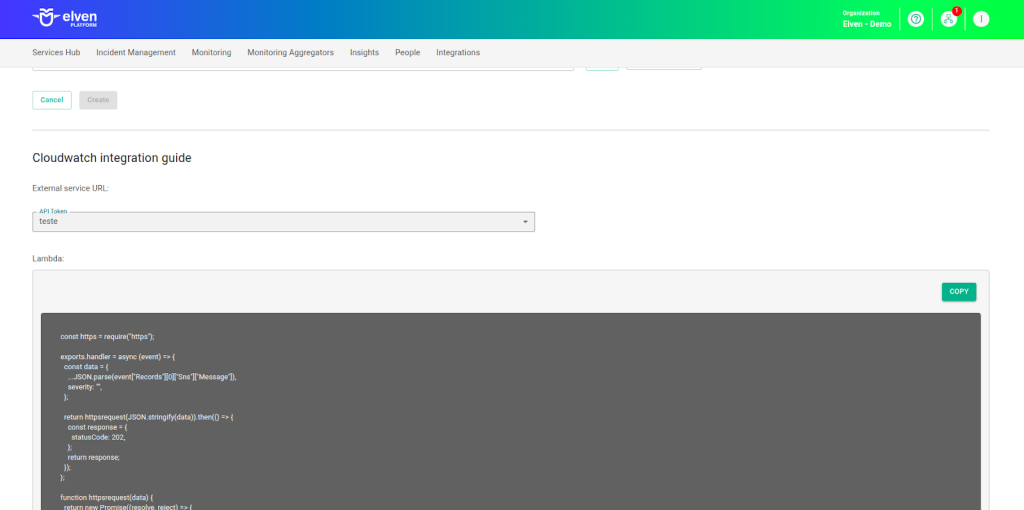
When configuring an External Service Incident CloudWatch, one of the most important steps is selecting the API Token you previously generated. This key acts as a unique credential that securely connects your system to the incident notification service. Think of it as a master key that enables authentication and communication between platforms. Make sure to choose the correct API Token and keep it protected, as it is essential for the service to function and to ensure the integrity of the integration.
After selecting the API Token, you will gain access to the function, which is generated automatically. This function will be responsible for mediating the communication between CloudWatch alarms and the Elven Platform, processing the received events and sending clear and actionable notifications. The integration is designed to transform raw data into structured incident notifications, ensuring that any important event is captured and delivered efficiently. This guarantees that you are always informed about the critical states of your resources, allowing for a fast and accurate response.
AWS Lambda and AWS SNS
This automation is a key component for speeding up the identification and response to issues in your monitoring environment. In this process, the Lambda function and the SNS (Simple Notification Service) play fundamental roles.
The Lambda function acts as the intelligent intermediary, processing the events generated by CloudWatch alarms. When properly configured, it transforms these raw notifications into information that can be sent to the Elven Platform, ensuring you receive clear and actionable incident notifications. Without Lambda, the automated data flow between CloudWatch and the Elven Platform would not be possible.
The SNS (Simple Notification Service) plays a crucial role as the “messenger” in the integration system with the Elven Platform. It manages and distributes the notifications generated by CloudWatch alarms, ensuring that each relevant event is delivered to the Lambda function and subsequently processed for delivery to the Elven Platform.
This configuration allows incident notifications to be forwarded efficiently and in real time to the platform, where they can be centralized and managed more effectively.
Configuring in CloudWatch
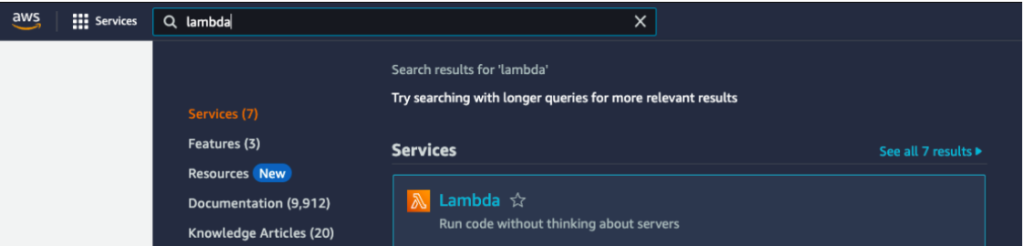
In AWS, you need to create a Lambda. In the services menu, search for Lambda, then click Create function:
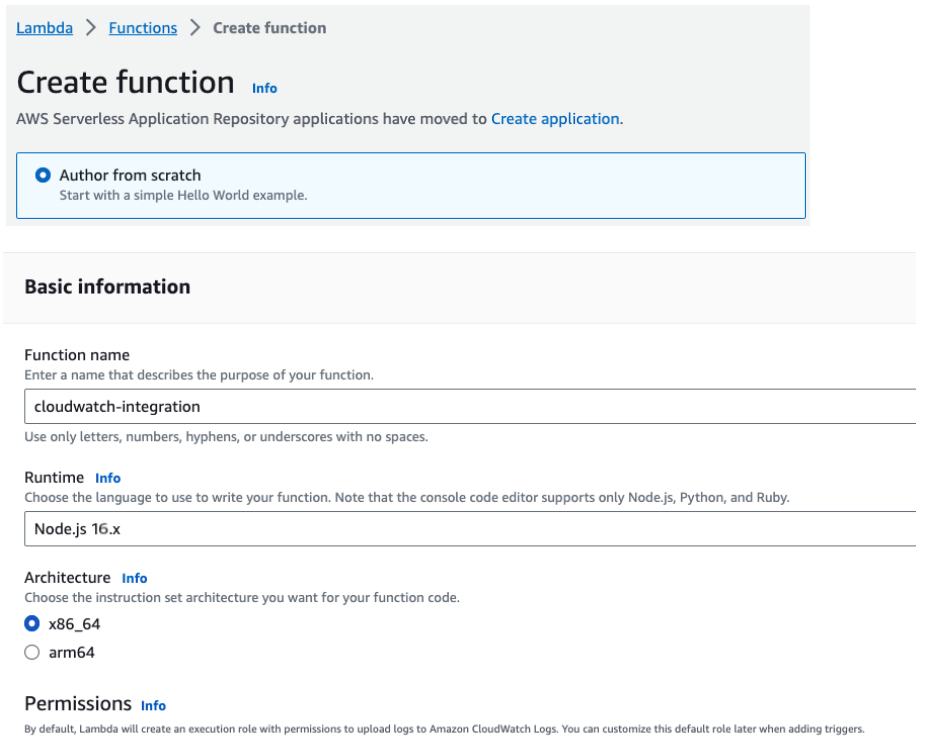
When creating the Lambda, you need to provide the name and the Runtime. By default, the one used is Node.js 20.x. After filling in the fields above, click Create function.
After accessing the created Lambda, in Code Source, replace the default content with the one obtained during the creation of the External Service CloudWatch.
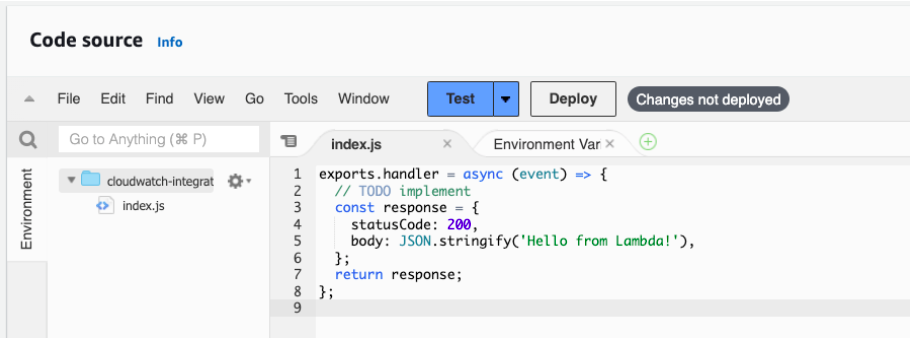
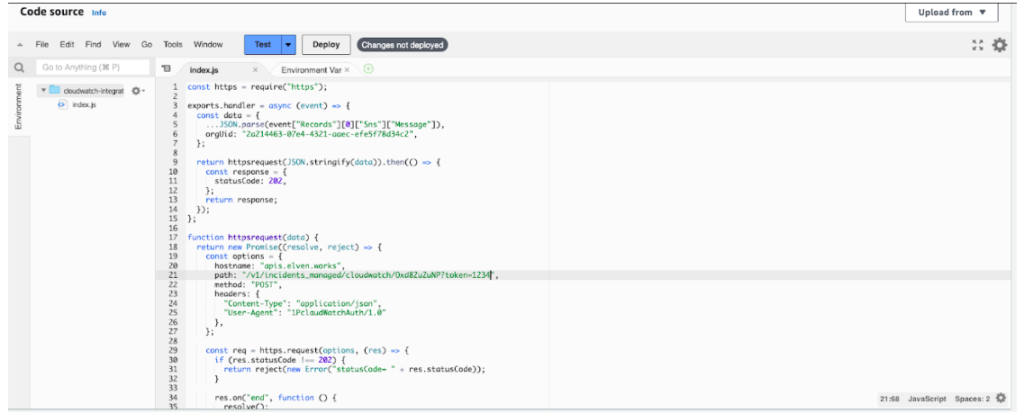
Click on Deploy after inserting the provided code.
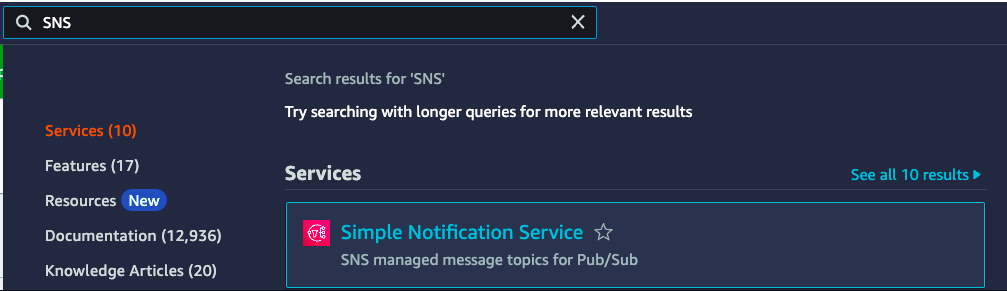
Access the SNS service.
After accessing the service, go to Topics and then click on Create Topic:
Select the Standard option and give it a name of your choice.
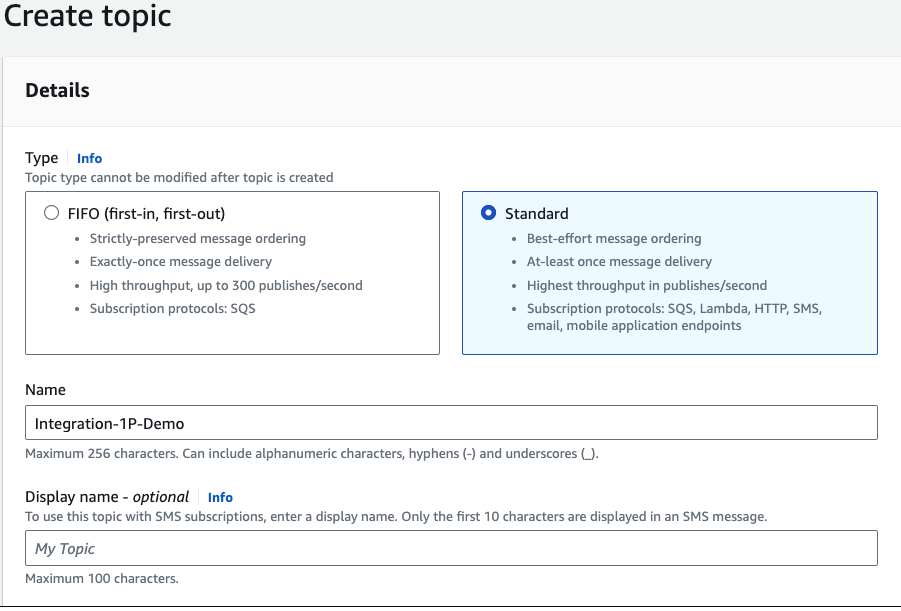
After that, click Create topic.
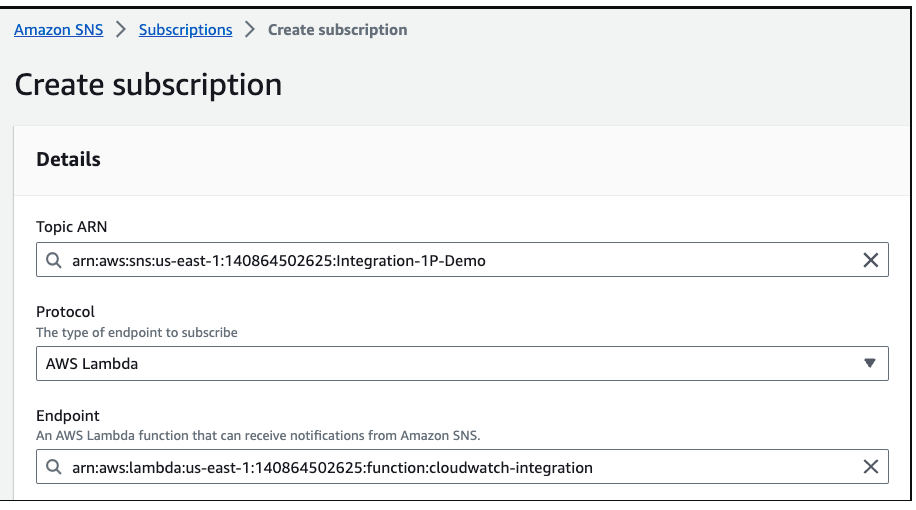
When creating the topic, the next step is to associate the created Lambda. To do this, scroll down to the bottom of the page and click Create subscription.
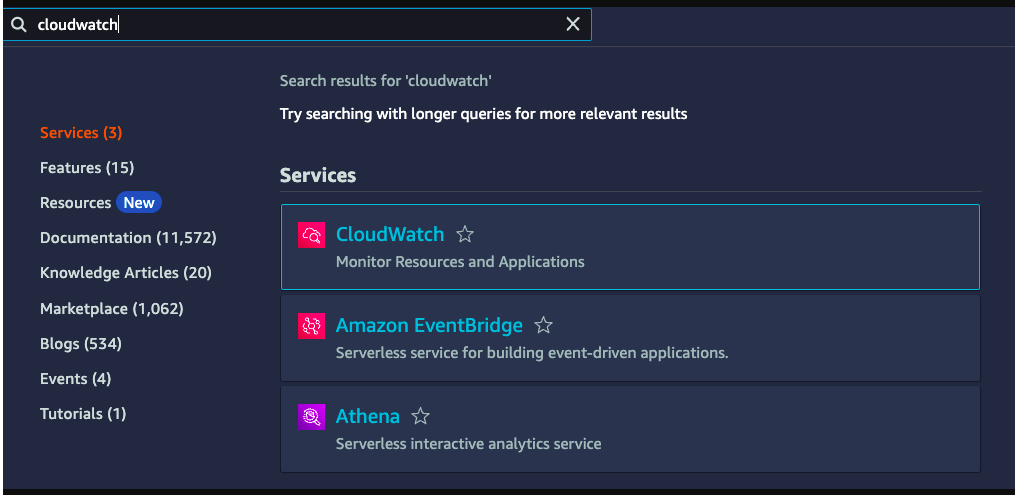
After creating the SNS Topic, we must configure it in CloudWatch.
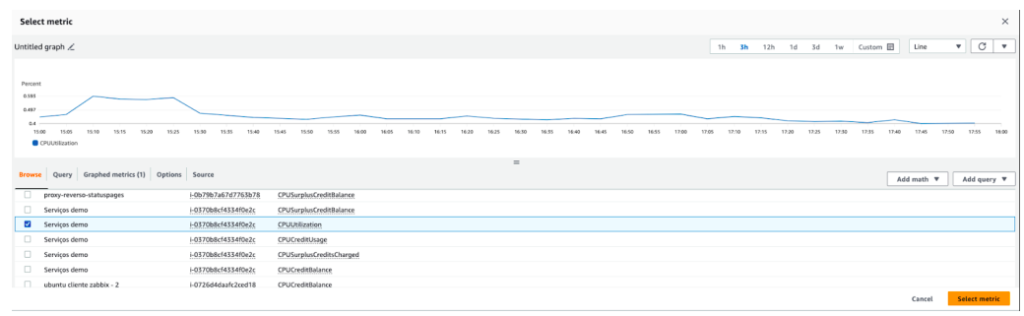
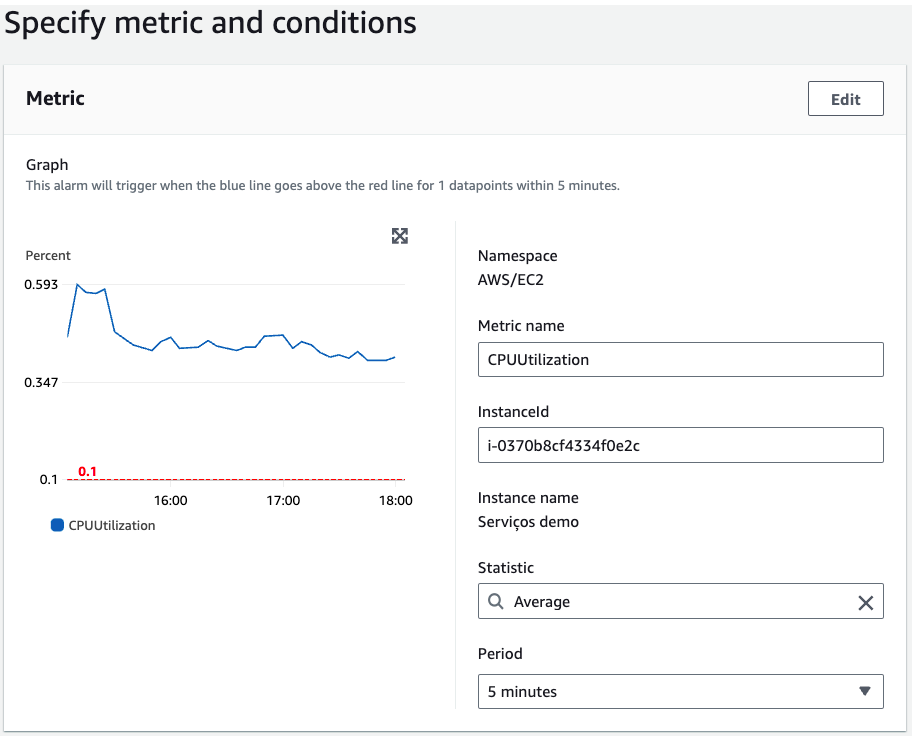
When accessing the CloudWatch service, the next step is to create the alarm by clicking Create alarm. Select the metric you want to monitor, in the example below, we are monitoring the CPU Utilization metric.
Define the conditions according to your operation.
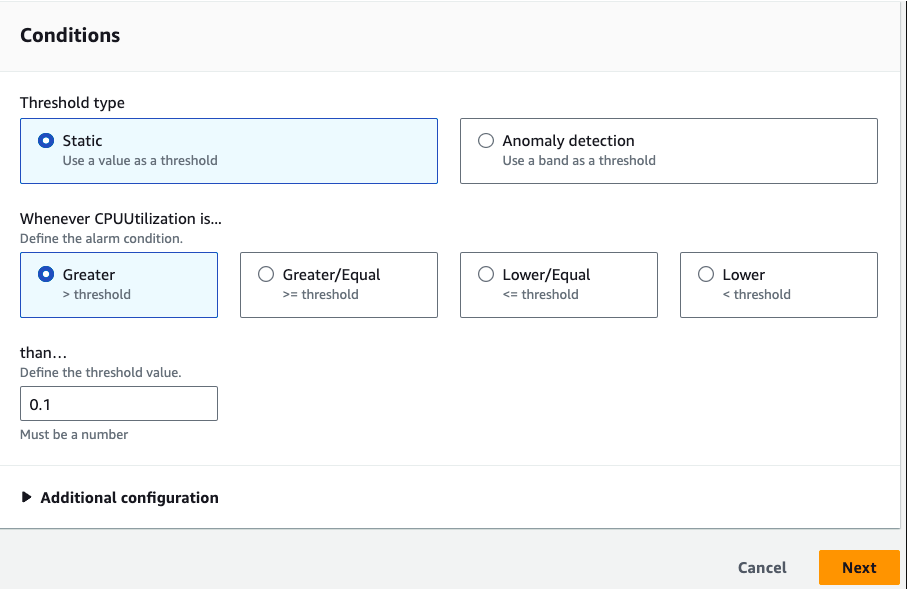
Click Next to proceed to the next step.
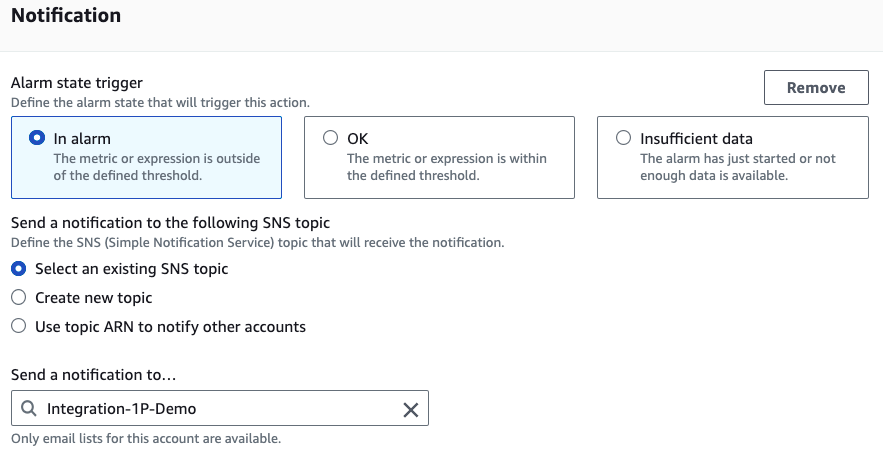
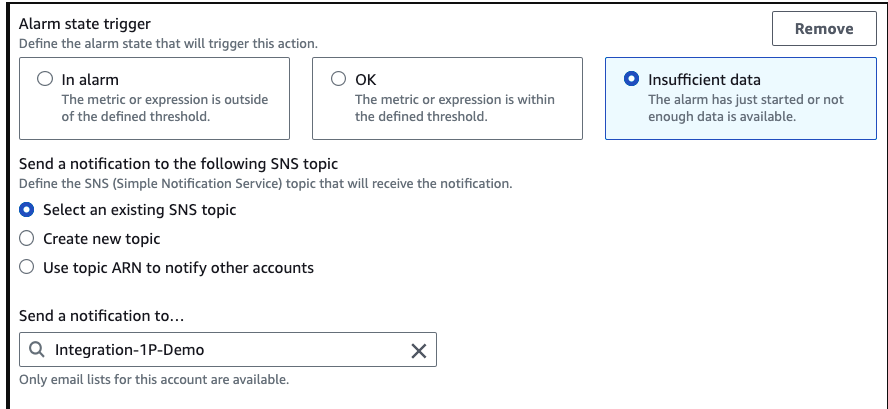
In Configure actions, we must set up the notification for all three statuses.
In Alarm
OK
Insufficient data
All of them must send to the SNS topic created, as shown in the example:
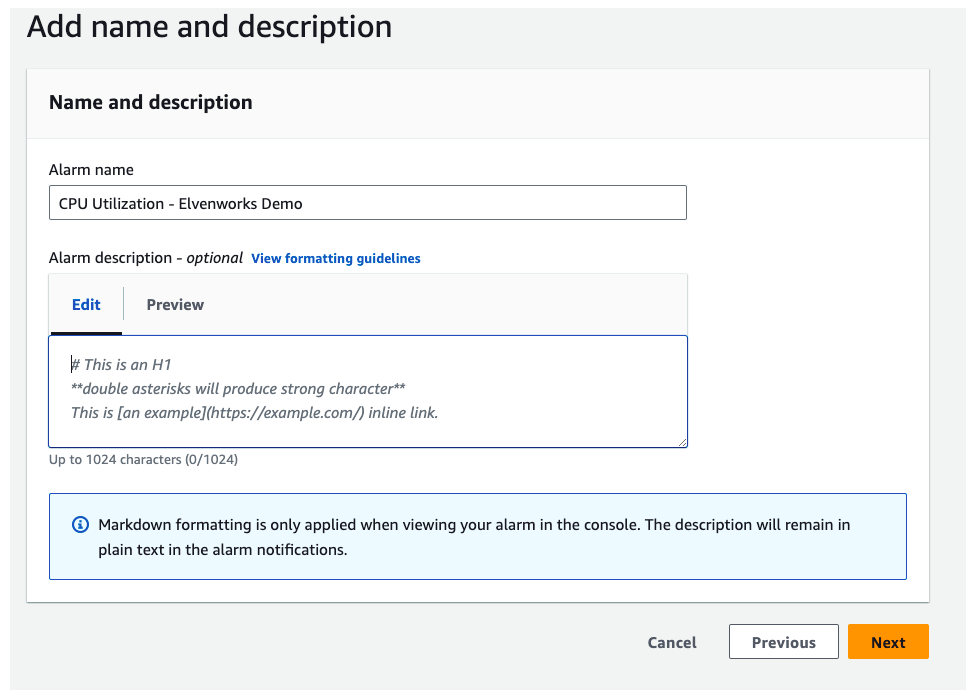
Click Next to proceed to the next step and then name the created alarm.
Verify if the alarm and conditions were created correctly and click Create alarm to finish. After that, all CloudWatch alerts should appear in the Elven Platform.
Once configured, the service will appear in the External Services Monitoring Center, categorized by status, making it easier to monitor incidents, with priority given to those in alarm state.
Additional security and performance settings
IP Whitelist: API communication can be configured to allow only authorized IPs. To enable or modify this setting, contact Elven Platform support.
Rate Limiting: The default request limiting time is 5 minutes, but it can be adjusted as needed. For changes, contact Elven Platform support.
These settings ensure greater security and control over the data traffic between the integrated systems.
Glossary of Technical Terms
API Token: A unique key used for secure authentication between systems. In the context of this documentation, it is essential for connecting CloudWatch to the Elven Platform.
CloudWatch: AWS monitoring service that collects and tracks metrics, monitors logs, and generates alarms for changes in your environment.
External Service Name: Descriptive name assigned to an external service integrated with the Elven Platform, used for identification in dashboards and reports.
Responders: People, teams, or systems designated to receive alert notifications and act accordingly.
Lambda Function: A function in AWS Lambda that processes events generated by CloudWatch alarms and forwards them to the Elven Platform.
SNS (Simple Notification Service): AWS messaging service that delivers notifications generated by CloudWatch alarms to the Lambda Function or other endpoints.
Node.js Runtime: Execution environment used for the Lambda Function. In this documentation, Node.js 20.x is mentioned as the default.
Code Source: Area within the Lambda Function where the processing code is inserted or edited before deployment.
Topics (SNS): SNS feature used to organize and distribute messages to specific subscribers, such as Lambda Functions.
Subscription: Association between an SNS Topic and an endpoint (e.g., a Lambda Function) that ensures notification delivery.
CPU Utilization: Common metric used in resource monitoring to assess CPU usage by instances or applications in AWS.
Standard Topic (SNS): Type of SNS Topic that delivers messages with maximum effort for availability and reliability.
Endpoint: Destination where SNS notifications are sent, such as a Lambda Function configured for integration.
Last updated
Was this helpful?