

Configuration Guide for External Service Incident Prometheus on the Elven Platform
The External Services Center of the Elven Platform is the bridge that connects you to the best tools on the market to monitor, manage, and resolve incidents in a simple and efficient way. Through it, you can integrate Prometheus with the Elven Platform, allowing the reception of alerts and events related to incidents directly on the platform. This enables you to monitor and analyze your applications and services from the perspective of Incident Management, using the best practices and methodologies available, all in one place.
API Token
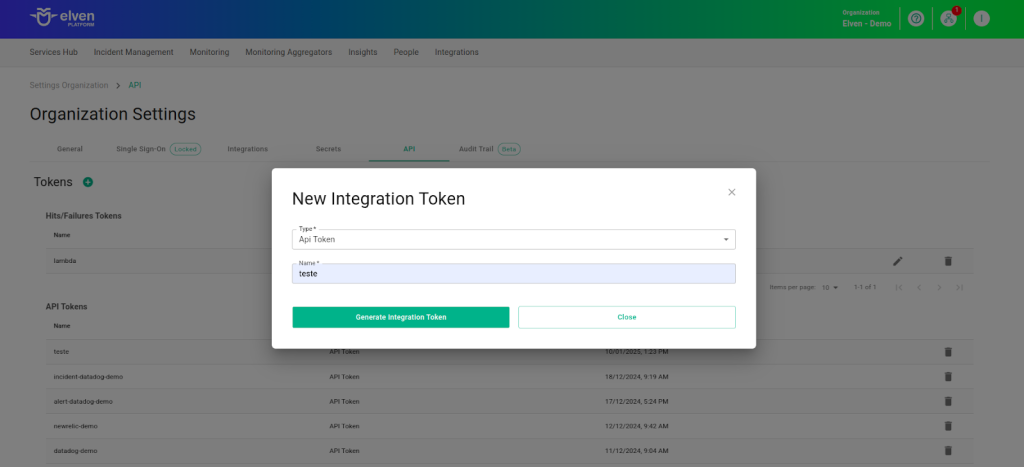
To integrate the Elven Platform with Prometheus, you need to create an API Token. This unique key is essential for the two platforms to connect securely, ensuring reliable and authenticated information exchange. Simply access the Organization Settings of the Elven Platform, navigate to the API section, and generate it.
Creating an API Token
In the top menu, under your user settings, click on Organization Settings.
In the API tab, click the + button to create a new API Token.
Accessing External Service Incident Prometheus
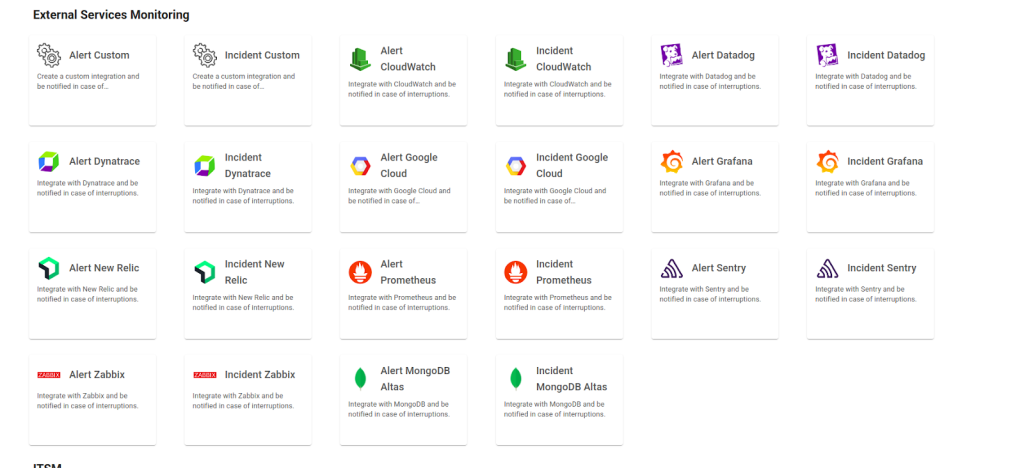
Navigate to the main menu and click on Services Hub.
In External Services Monitoring, select the Incident Prometheus item.
Creating the External Services Incident Prometheus
In the form, start by filling in the External Service Name field, which will be the name of the external service, and define the Responders, that is, the people or teams who will receive notifications related to this service. After that, click CREATE to proceed. This action will create the initial record of your external service.
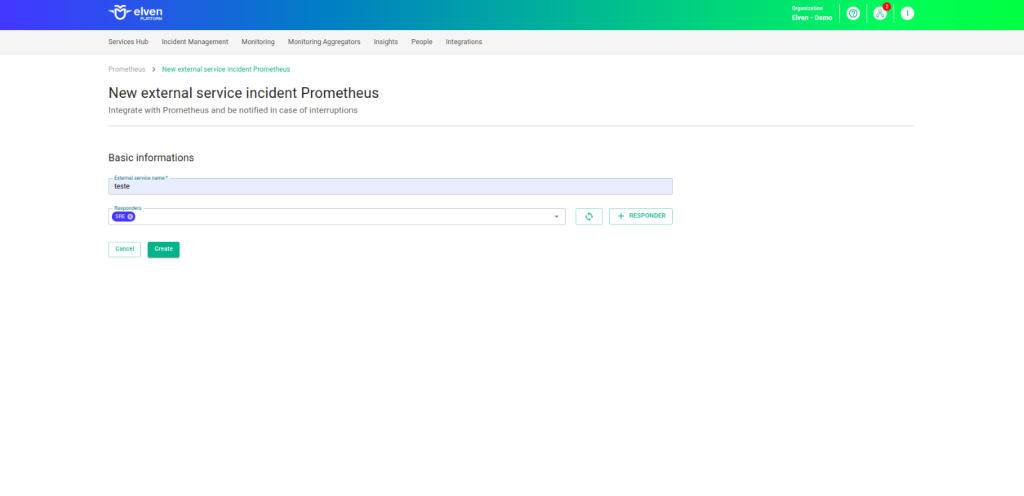
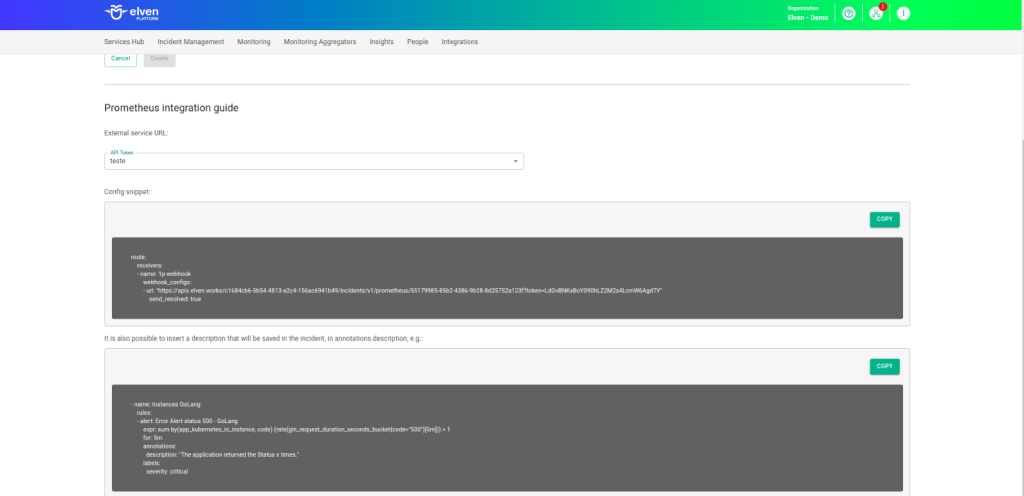
Next, locate the API Token you generated earlier and select it to configure the integration with Prometheus.
Configuring Webhooks in Prometheus
Integrating Prometheus with the Elven Platform is a simple and straightforward process, designed to provide an efficient and intuitive incident management experience. Below, we detail the steps to configure the webhook, routes, and alerts in Prometheus, enabling seamless integration with the Elven Platform.
The receivers in Prometheus Alertmanager are the destination points for the alerts generated by the system. To configure them, access the Alertmanager configuration file. At this stage, enter the information provided by the Elven Platform, such as the webhook URL and the necessary credentials. Make sure to name the receivers clearly and descriptively to facilitate identification, such as “Elven Platform Receiver.” This ensures that alerts are correctly routed to the platform.
The routes in Alertmanager are responsible for determining how alerts are forwarded to the receivers. In the same file, the Alertmanager configuration file, go to the routes section and define the routing rules. Here, you can configure specific conditions, such as severity levels or monitored services, to direct the appropriate alerts to the correct receivers. For example, a route can be configured to send critical alerts directly to the Elven Platform, ensuring that the most important events receive priority attention.
Finally, access the alerts section in the Prometheus values files. This is where you define the conditions that trigger alerts, such as high CPU usage, application failures, or critical service outages. Use the information obtained during the External Service setup in the Elven Platform to create rules that meet your specific needs.
Configure the Receiver
Configuring Routes
Configuring Alerts
Once configured, the service will appear in the External Services Monitoring Center, classified by status, making it easier to monitor incidents with priority given to those in an alarm state.
Additional Security and Performance Settings
IP Whitelist: API communication can be configured to allow only authorized IPs. To enable or modify this setting, contact Elven Platform support.
Rate Limiting: The default request limiting time is 5 minutes, but it can be adjusted as needed. For changes, contact Elven Platform support.
These settings ensure greater security and control over the data traffic between the integrated systems.
Glossary of Technical Terms
API Token: A unique identifier used to authenticate communication between the Elven Platform and Prometheus. It ensures secure and reliable information exchange between the platforms. Organization Settings: Configuration section in the Elven Platform where you can create and manage API Tokens, as well as adjust other organizational settings. Services Hub: Area in the main menu of the Elven Platform where external services can be configured, monitored, and managed. External Service Name: Name assigned to the external service during setup, used for identification within the Elven Platform. Responders: Teams or individuals who receive notifications related to alerts generated by the configured service. Webhook: Integration point that allows Prometheus alerts to be automatically sent to the Elven Platform. Receivers: Destinations configured in Prometheus where alerts will be sent. They are defined in the values file and connected to the webhook provided by the Elven Platform. Routes: Routing rules configured in Prometheus to determine how alerts are sent to receivers. They can be set based on criteria such as severity or monitored service type. Alerts: Conditions defined in Prometheus that trigger notifications based on specific events or metrics, such as resource usage or application failures. External Services Monitoring Center: Dashboard within the Elven Platform where configured external services are monitored, displaying status, incidents, and active alerts. Status: Classification assigned to services in the monitoring dashboard, indicating their current state, such as “Active”, “Inactive”, or “In Alarm”. High CPU Usage: An example of a condition that can be configured as an alert in Prometheus, indicating that a resource is operating beyond its ideal capacity. Critical Service Outages: A type of alert that can be configured to signal when an essential service experiences failures or downtime.
Last updated
Was this helpful?