

Configuration Guide for External Service Alert Grafana on the Elven Platform
The External Services Center of the Elven Platform is the bridge that connects you to the best tools on the market to monitor, manage, and resolve incidents in a simple and efficient way. Through it, you can integrate Grafana with the Elven Platform, allowing the reception of alerts and incident-related events directly within the platform. This enables you to monitor and analyze your applications and services from the perspective of Incident Management, using the best practices and methodologies available on the market, all in one place.
API Token
To integrate the Elven Platform with Grafana, you need to create an API Token. This unique key is essential for the two platforms to connect securely, ensuring reliable and authenticated information exchange. Simply access the Organization Settings of the Elven Platform, navigate to the API section, and generate it.
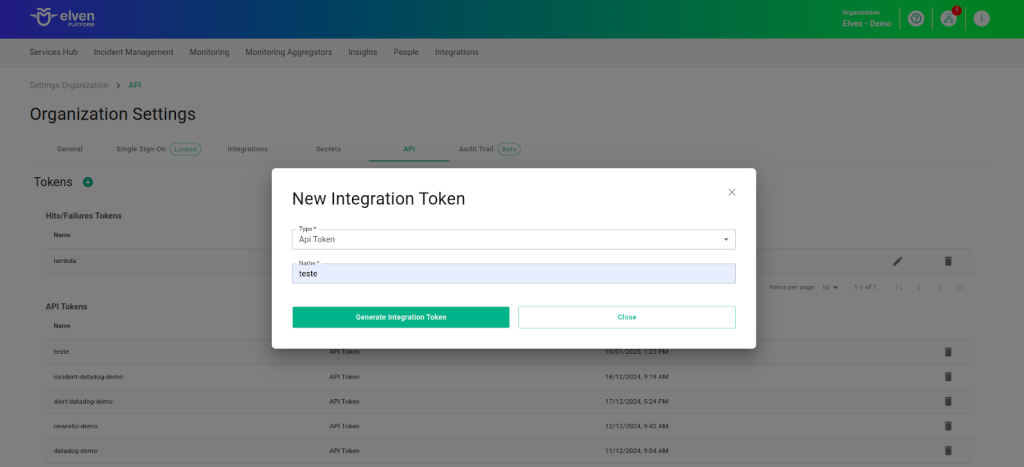
Creating an API Token
In the top menu, under your user settings, click on Organization Settings.
In the API tab, click the + button to create a new API Token.
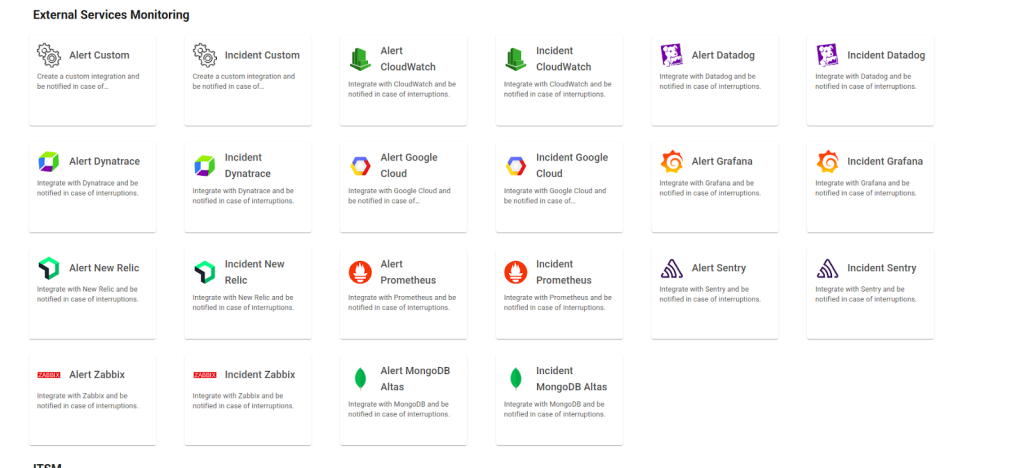
Accessing External Service Alert Grafana
Navigate to the main menu and click on Services Hub.
Under External Services Monitoring, select the Alert Grafana item.
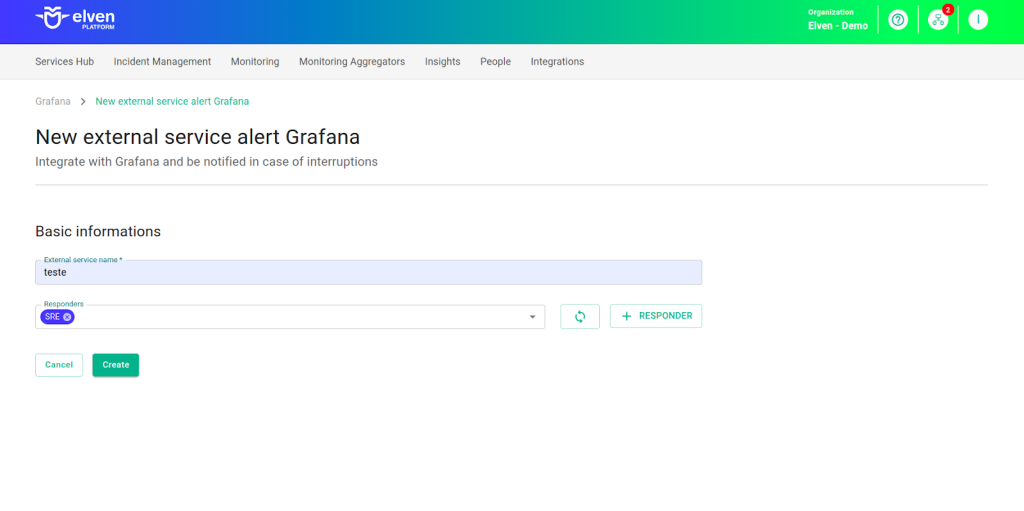
Creating the External Services Alert Grafana
In the form, start by filling in the External Service Name field, which will be the name of the external service, and define the Responders, that is, the people or teams who will receive notifications related to this service. After that, click CREATE to proceed. This action will create the initial record of your external service.
Next, locate the API Token you generated earlier and select it to configure the integration with Grafana.
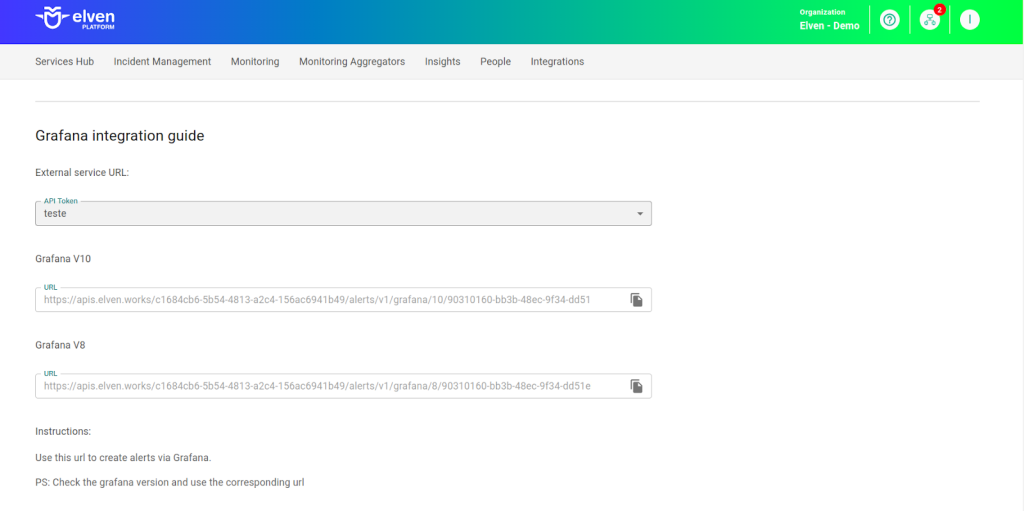
Configuring Webhooks in Grafana
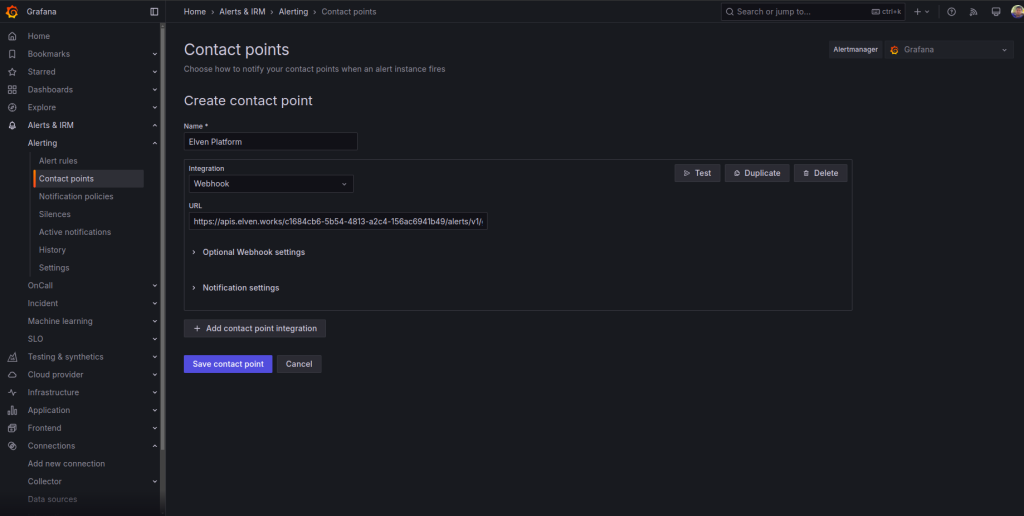
Connecting Grafana to the Elven Platform is a simple and intuitive process, especially with dedicated support for Grafana versions 8 and 10. To begin, access the menu on the left in Grafana and click on Contact Point, where you will find the option Add Contact Point. In the form, define a name for the contact point, such as “Elven Platform”, to make it easier to identify within the platform. Choose the Webhook integration type, which allows real-time alert delivery. In the URL field, enter the URL generated in the Elven Platform, making sure to select the URL corresponding to the Grafana version you are using, either 8 or 10. This compatibility ensures that the tools integrate seamlessly, maintaining a consistent notification flow.
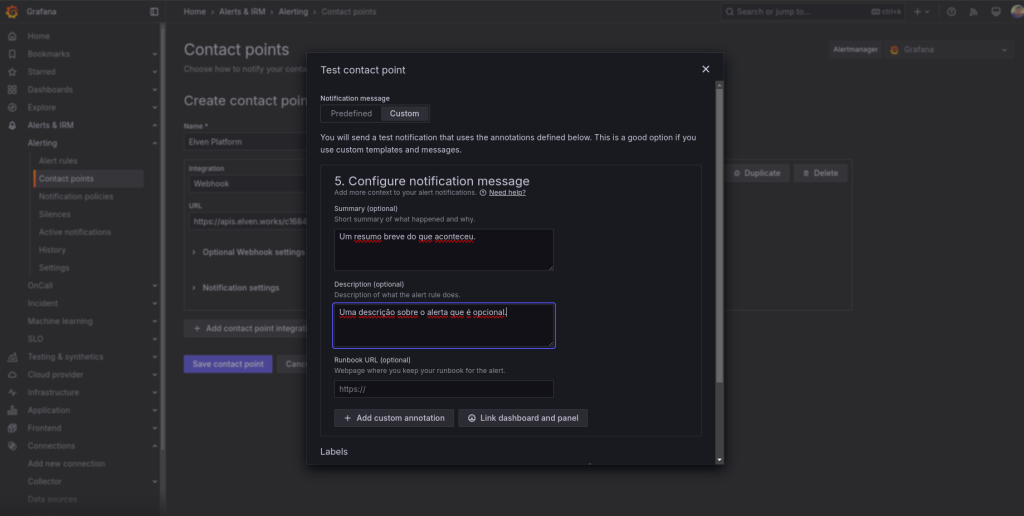
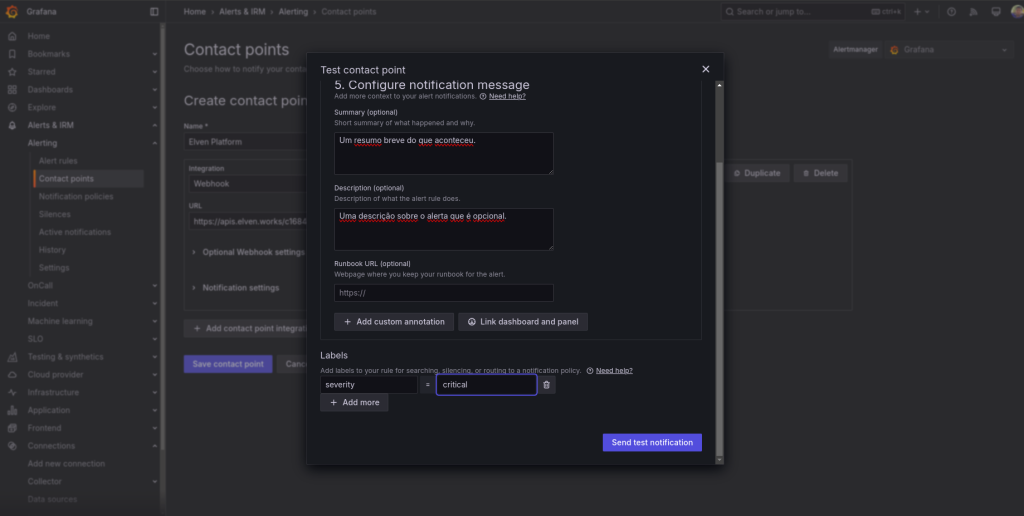
When performing the test, remember to create a label called severity. The value of this label should represent the severity of the event, using one of the predefined categories by the Elven Platform.
critical
high
moderate
low
informational
Make sure to choose the value that best describes the severity of the scenario. This standardization ensures clarity and facilitates understanding in the monitoring and management of alerts. With this integration, you transform incident management by centralizing all critical information directly in the Elven Platform. In addition to being easy to configure, support for different Grafana versions ensures that no technical detail becomes an obstacle, providing an experience tailored to your needs. Your team will always be connected and ready to act, ensuring agility and security in monitoring and problem resolution.
In Grafana, in the left menu, go to Contact Point and click on Add Contact Point.
Once configured, the service will appear in the External Services Monitoring Center, categorized by status, making it easier to monitor incidents, with priority given to those in an alarm state.
Additional Security and Performance Settings
IP Whitelist: API communication can be configured to allow only authorized IPs. To enable or modify this setting, contact Elven Platform support.
Rate Limiting: The default request limit interval is 5 minutes, but it can be adjusted as needed. For changes, contact Elven Platform support.
These settings ensure greater security and control over the data traffic between the integrated systems.
Glossary of Technical Terms
API Token: A unique key generated in the Elven Platform to enable secure authentication and information exchange between the platform and external tools like Grafana. External Services Monitoring: Area of the Elven Platform that lists integrated external services, allowing you to monitor status, respond to incidents, and configure notifications. Contact Point: A Grafana feature used to configure alert contact points, such as Webhooks, ensuring real-time notifications. Webhook: A communication method between systems that automatically sends notifications to a specific URL, connecting Grafana to the Elven Platform. URL: The address generated by the Elven Platform that must be used when configuring a Webhook in Grafana. It is specific to the Grafana version being used (8 or 10). Responders: People or teams defined in the configuration of an external service who will receive incident notifications. Alert Grafana: A specific service within External Services Monitoring in the Elven Platform for configuring Grafana alert integration. Alarm Status: A visual classification in the External Services Monitoring Center that highlights services in an alert state to prioritize actions. Grafana Version: The specific version of Grafana (such as 8 or 10) that determines the corresponding Webhook URL configuration. Incident Management: The process of monitoring, analyzing, and responding to critical events to minimize impact on systems and services. Real-Time Notifications: Messages sent immediately after an incident is detected, enabling quick actions to resolve issues. External Service Name: The name assigned to an external service during configuration in the Elven Platform to facilitate identification and organization. Consistent Notification Flow: Ensures that alerts generated in Grafana reach the Elven Platform without interruptions, optimizing incident management.
Last updated
Was this helpful?